
In simple words, simple linear regression is finding the best fit line for one input and one output variable and predict the output value for each given input data. Here input and output are independent and dependent variables respectively.
Hello fresh minds,
In this article I will try to explain the concept of simple linear regression in very easy to understand language. Let’s get started.
What is Linear Regression ?
It is nothing but a supervised learning algorithm that aims to find the best-fitting straight line through the data points to make predictions or find out the relationship between the variables. Means it solves the regression problem (where output column is numerical). Linear regression is a statistical and machine learning technique that is used for modeling the relationship between a dependent variable (also known as the target or output variable) and one or more independent variables (also known as feature variables). See the below image for better understanding of hierarchy.
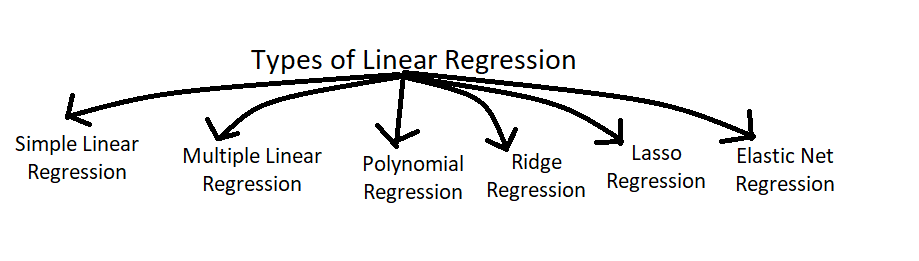
As you can see in above image (created by me 😎) there are various types of linear regression. Well we usually make use of very few of them for our datasets. In this article I will focus on only Simple Linear Regression.
What is Simple Linear Regression ?
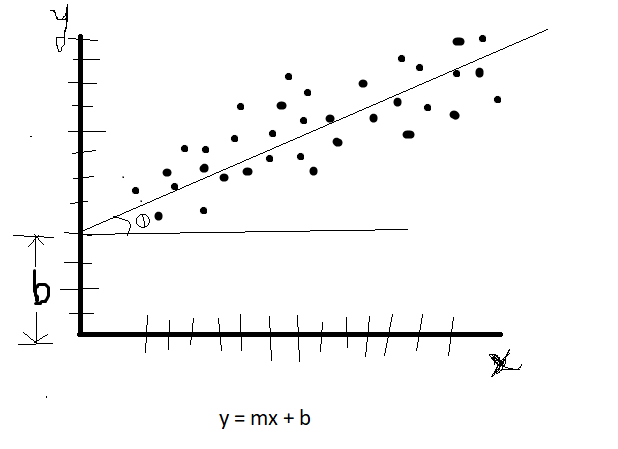
This is probably most basic form of linear regression, where there is only one independent variable (predictor) and one dependent variable (target). means one input column and one output column that’s it. The relationship between the independent and dependent variables is assumed to be linear, and guess what the goal is to find the best-fitting straight line through the data points.

Here x axis has independent variables, and y axis had dependent variables. So we can say that y is dependent on how x is changing. As x grows, y also grows. As you can see this is very very easy to understand right. This is because it is very intuitive algorithm and people usually start learning this algorithm when they start ML journey.
Always keep this thing in mind that, raw data will never be linear all the time (99.99% times) so you cannot get your best fit line through all data points right. As you saw in above image as well. Some of the data points are kind of away from the best fit line. And that is ok for us, we don’t want all data to be exactly linear. We can work with sort of linear data as well.
Do you know in statistics, what is the equation of a line.
y = mx + b
Where, y is output variable, x is input variable, m is slop(Theta), b is y-intercept.
We can consider m as weightage, means how much it is dependent on input variable. and b as a offset, means even if input values are nothing(zero) we will still have some output values with us to get start with. See below.
Using Machine Learning Example
Let’s see an example of training the model with machine learning (simple linear regression).
Download CSV file here.
In this machine learning example we are going to train our placement dataset with simple linear regression algorithm and predict outputs. Sounds exciting right, lets go then.
Import all files and libraries.
import pandas as pd
import numpy as np
import matplotlib.pyplot as plt
df = pd.read_csv('placement.csv')First thing first, just plot the data and see.
plt.scatter(df['cgpa'], df['package'])
plt.xlabel('cgpa')
plt.ylabel('package in (LPA)')
As you can see, data is sort of in linear manner. As cgpa is growing, package is also growing.
Let’s build the model now. Separate input and output variables from dataset table.
X = df.iloc[:,0:1]
y = df.iloc[:,-1]
Apply train test split for creating training and testing subsets.
from sklearn.model_selection import train_test_split
X_train, X_test, y_train, y_test = train_test_split(X, y, test_size = 0.2, random_state = 2)
Import linear regression class and train the training data using fit function.
from sklearn.linear_model import LinearRegression
lr = LinearRegression()

lr.fit(X_train, y_train)
Now just predict the values with X_test and compare it with y_test values one by one.
lr.predict(X_test.iloc[0].values.reshape(1,1))You can also show the best fit line in graph.
plt.scatter(df['cgpa'],df['package'])
plt.plot(X_train,lr.predict(X_train),color='red')
plt.xlabel('CGPA')
plt.ylabel('Package(in lpa)')
See the full output code here.
That’s it, this is how you can use simple linear regression algorithm on ML model to train it and predict values afterwards.
Conclusion
Each type of linear regression serves specific purposes and is suitable for different data characteristics. Choosing the appropriate type of linear regression depends on the nature of the data and the goals of the modeling task. I hope you must have learn something. Read the article carefully to get full understanding of topic. Thanks. Always remember ‘Data Makes You Rich‘.
hello