Workspace is like a container in which all your reports, dashboards, and semantic model dataset are listed for easy navigation. Workspace is also shared with other members of the group so that they can contribute to it.
Overview
After loading and shaping data, creating visuals, and adding formulas in Power BI, the next step is to share your reports. Workspaces in Power BI are like shared folders where you can collaborate with colleagues to build and store collections of reports and dashboards.
Workspaces have these advantages:
- Easy collaboration: Store reports and dashboards for multiple teams.
- Share and present reports in one place.
- Control access to models, reports, and dashboards for security.
This article covers creating and managing workspaces in Power BI, importing assets, setting up data protection, and troubleshooting.
Create a Workspace
Making a workspace in Power BI lets you store and share reports, collaborate with teams, and update reports easily.
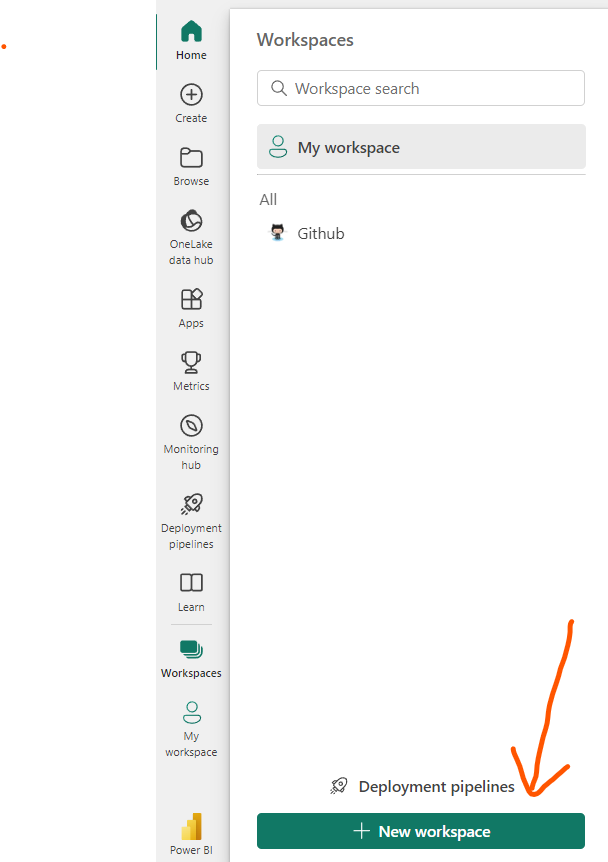
Your first task is to create a workspace by following these steps:
- Go to Power BI service.
- Select the Workspaces menu from left navigation blade.
- Select the Create a workspace button at the bottom of the resulting panel.
In the Create a workspace window, enter information in the Workspace name and Description fields and then upload a Workspace image.
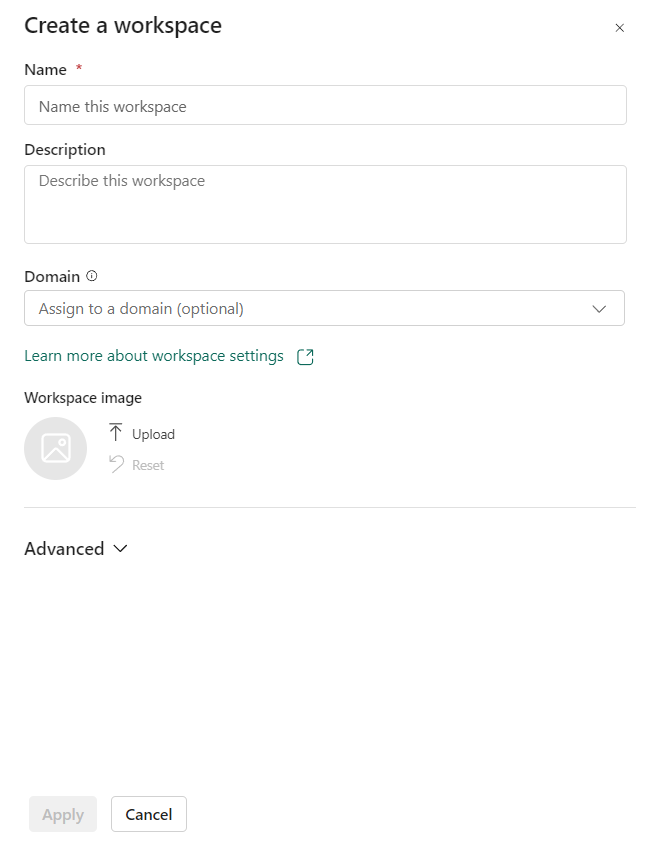
In the Advanced menu, set up a contact list for users who’ll get notifications about workspace issues. By default, it’s the admins, but you can add others. You can link the workspace to a OneDrive and decide if it’ll have its own resources (Premium feature). After filling out details, click Save.
Assign Workspace Roles
After creating a workspace, the Sales team wants to work with other teams on dashboards. As the owner, you want to give access to the Products team, including stakeholders and developers. Workspace roles control what people can do.
There are four roles, and it’s best to give minimal access. Skip assigning roles for consumers; they’ll access via the app. Roles:
Admin: Full control
- Update and delete the workspace
- Add or remove people, including other admins
Member: Edit content
- Add members or others with lower permissions
- Publish, unpublish, and change permissions for an app
Contributor: Add content
- Create, edit, and delete content, such as reports, in the workspace
- Publish reports to the workspace
Viewer: View only
- View and interact with an item
- Read data that’s stored in workspace dataflows
Note: If the workspace is backed by a Premium capacity, a non-pro user can view content within the workspace under the Viewer role.
To assign these roles to users, go to the workspace that you’ve created and in the upper-left corner of the ribbon, select Manage Access.
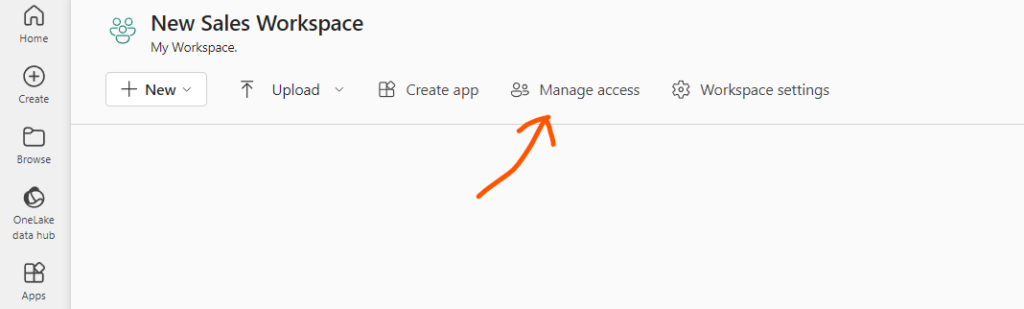
In the Access window, add email addresses or groups and assign them roles.
Create and configure an app
Once you’ve set up an app workspace and assigned roles, you add content like reports and dashboards. An app is a way to share data with others, but to publish and view it, you need a Pro license. You can publish from Power BI Desktop or upload files to the workspace.
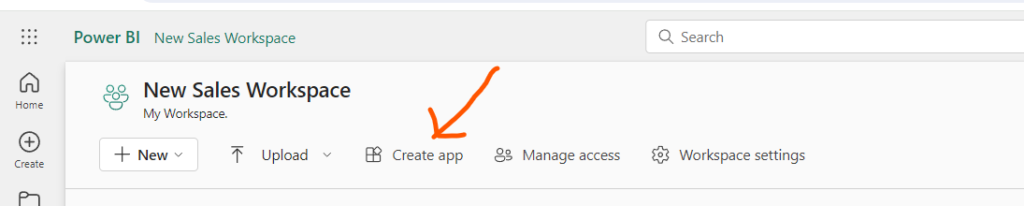
When you are ready to publish your app with its collection of reports, dashboards, and semantic models, return to the workspace and select Create app in the upper-left corner of the ribbon.
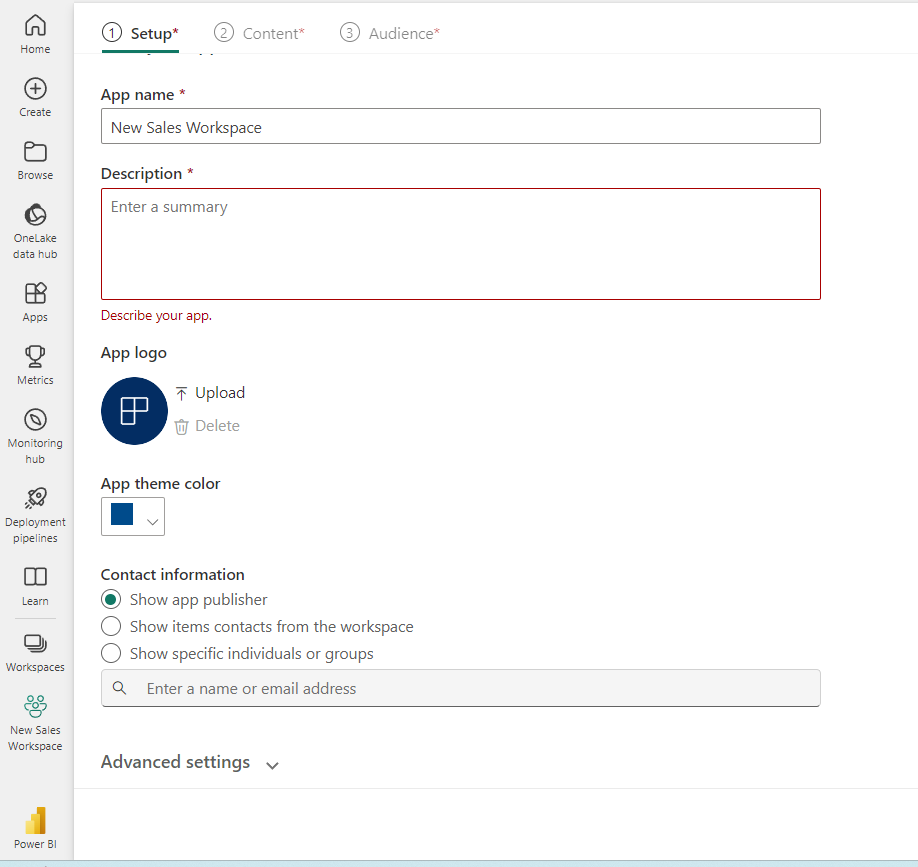
The Build your app experience starts on the Setup page, where you add a name and description for the app. You can also customize the theme color and add a logo if desired.
Under the Content tab, you can choose which content to include and change the viewing order. You can add content in the workspace, new sections for grouping, and external links.
In the Audience tab, you’re now able to choose one or more audiences with different viewing options. First, you’ll select which reports you want visible to the default audience created. Select what content each audience sees by toggling the eye icon on the right.
After selecting the viewable content, you can Manage Audience Access. You can Grant access to the Entire organization or Specific users or groups. For Specific users or groups, you can enter any mail-enabled account accessible within your Power BI tenant.
In the Advanced section, you can choose to grant additional permissions, individually or neither:
- Allow people to share the semantic models in the app audience
- Allow people to build content with the semantic models in the app audience
Lastly, notice that Workspace users are already included in the audience by default. This goes back to the roles we covered earlier.
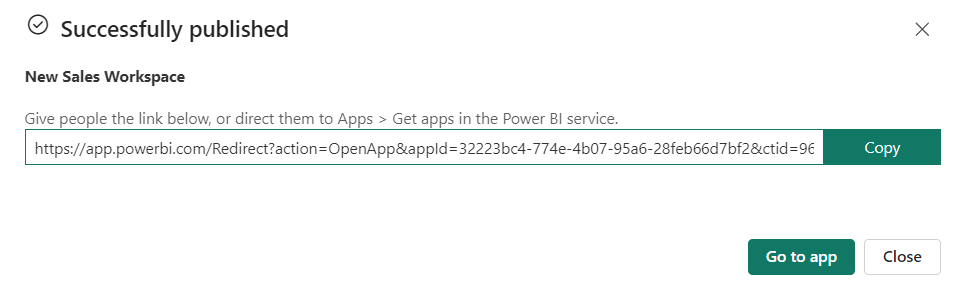
When you’re ready, select Publish app. Congratulations, you just published an app! You’ll receive a notification with the link to distribute to consumers, and an option to go to the app.
After publishing your app, you realize that you want to make updates within your workspace.
Don’t worry, it’s as easy as publishing your app. From the workspace, the Create app button will now say Update app. Select Update app, then move to the appropriate section and make your changes. When ready to save your changes, select the Update app button in the bottom where Publish App was before.
Monitor usage and performance of Workspace:
Understanding how your workspace is used and performs is important because:
- Helps you focus on improving areas that need it most.
- Shows the impact of your reports, letting you see their success.
These metrics let you see who’s using your reports, what they’re doing, and any performance issues. For instance, if you’re in Sales Analysis, and more users are joining your workspace, you’ll want to monitor usage and performance as it grows.
Troubleshoot data by viewing its lineage:
The Lineage view feature in Power BI allows you to quickly refresh semantic models and see the relationships between the artifacts in a workspace and their external dependencies.
The path of data from its source to the destination can often be a considerable challenge, more so if you have multiple semantic models. The Lineage view feature can help you accomplish this task efficiently and almost effortlessly.
Data lineage
Data lineage shows how data moves from its source to its destination.
In Power BI, the Lineage view is important because:
- It helps troubleshoot by showing the data’s path, letting you find problems easily.
- You can manage workspaces and see how changes affect reports.
- It saves time by highlighting reports that need refreshing.
Use the Lineage view
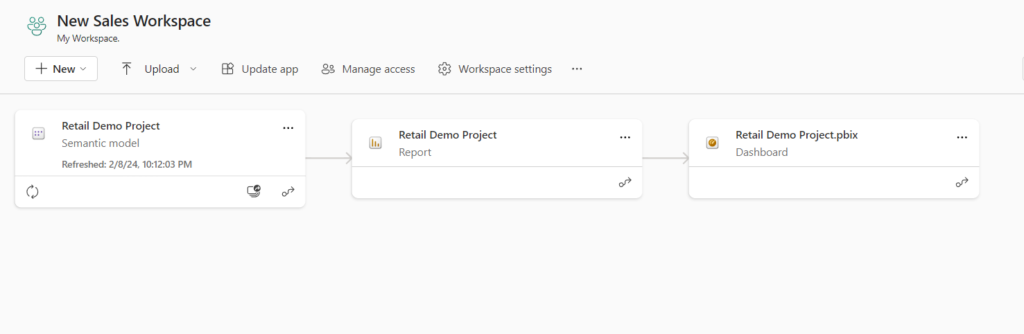
The Lineage view is only accessible to Admin, Contributor, and Member roles. To access the Lineage view, go to the workspace, and then select Lineage from the View menu on the top right ribbon.
For Retail Sales Analysis following is the lineage view.
I hope through this article you must have learn how to navigate the Power BI service, create and manage workspaces and related items, and distribute reports to users.