
The train-test-split function in sklearn helps you split your data into two groups, one for training your model and another one for testing to see how well your model works.
The main purpose of splitting dataset into training and testing sets is to assess how well the model can generalize to new and unseen data.
Let’s understand this by my below example
Just imagine you have a bunch of toys and you want to know how well you can predict which ones a friend will like based on their features. Features can be like color, shape, and size. You want to train a model to make these predictions.
But you don’t want to use all your toys for training because then you won’t have any left to test and see that how well your model works. So, you decide to divide your toys into two groups which are one for training and one for testing.
The train_test_split function in the sklearn library helps you do that. Most of the engineers prefer to use this you know. It takes all your data and splits them randomly into two groups. Let’s say you want to use 80% of your data for training and keep the remaining 20% for testing. You can always change this ratio according to your need by the way. That’s great right.
The function will take care of the rest, the randomly picking 80% of your data and put them into one group for training. This group will have data with their features. It will help the model learn which features are important for prediction.
Real Life Example
I am using a dataset here for demo purposes, which is predicting car prices.
Download it from here: carprices
We have a dataset containing prices of used BMW cars. We are going to analyze this dataset and build a prediction function that can predict a price by taking mileage and age of the car as input. We will use sklearn train_test_split method to split training and testing dataset.
Import basic necessary libraries.
import pandas as pd
df = pd.read_csv("carprices.csv")
df.head()
Mileage Age(yrs) Sell Price($)
0 69000 6 18000
1 35000 3 34000
2 57000 5 26100
3 22500 2 40000
4 46000 4 31500Let’s plot some graphs to see any relations between data:
import matplotlib.pyplot as plt
%matplotlib inline
Car Mileage Vs Sell Price ($)
plt.scatter(df['Mileage'],df['Sell Price($)'])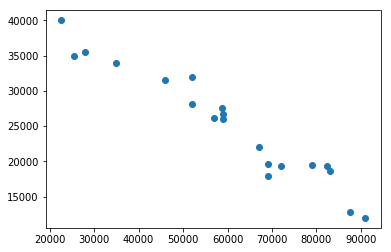
Car Age Vs Sell Price ($)
you can give labels as well, its completely optional.
plt.scatter(df['Age(yrs)'], df['Sell Price($)'])
plt.xlabel('Age(yrs)')
plt.ylabel('Sell Price($)')
Looking at above two scatter plots, using linear regression model makes sense as we can clearly see a linear relationship between our dependent (i.e. Sell Price) and independent variables (i.e. car age and car mileage)
The approach we are going to use here is to split available data in two sets
- Training: We will train our model on this dataset
- Testing: We will use this subset to make actual predictions using trained model
The reason we don’t use same training set for testing is because our model has seen those samples before, using same samples for making predictions might give us wrong impression about accuracy of our model. It is like you ask same questions in exam paper as you taught the students in the class.
Now divide data into two parts, input(X) and output(y).
X = df[['Mileage','Age(yrs)']]
y = df['Sell Price($)']
Now apply train_test_plit()
from sklearn.model_selection import train_test_split
X_train, X_test, y_train, y_test = train_test_split(X,y,test_size=0.2)
X_train
Remember, here X is input variable and y is output target variable. The parameter test_size = 0.2 tells use that 20% data is for testing and remaining is for training.
It returns us four things as X_train, X_test, y_train, y_test.
Input(X) has 80% training data and 20% testing data.
Output(y) has 80% training data and 20% testing data.
       Mileage	Age(yrs)
11	79000	7
17	69000	5
10	83000	7
1	35000	3
0	69000	6
8	91000	8
7	72000	6
16	28000	2
6	52000	5
4	46000	4
19	52000	5
2	57000	5
5	59000	5
15	25400	3
Lets run linear regression model now
from sklearn.linear_model import LinearRegression
clf = LinearRegression()
clf.fit(X_train, y_train)
After training the model let’s predict some values.
clf.predict(X_test)array([ 38166.23426912, 25092.95646646, 16773.29470749, 24096.93956163,
22602.44614295, 15559.98266172])You can always compare these values with y_test.
Now let’s see accuracy score.
clf.score(X_test, y_test)0.92713129118963111That’s it.
Code download it from here: carprices
Conclusion
The train_test_split() function returns four separate datasets: X_train, X_test, y_train, and y_test, representing the training and testing sets for both the input features and target values. These datasets can then be used to train the model and evaluate its performance.