Supply Chain Management for Car in Power BI project includes working of Power BI, SQL, and Python. This project is for all beginners who wants to learn and understand about Power BI end-to-end dashboard project.
Overview
Supply Chain Management for Cars in Power BI provides a comprehensive overview of the entire supply chain process for automotive companies. This includes tracking the flow of materials, components, and finished products from suppliers to manufacturers, distributors, and ultimately to customers.
Using Power BI, companies can visualize key supply chain metrics such as inventory levels, production schedules, delivery performance, and supplier quality. They can also analyze historical data to identify trends, optimize operations, and make informed decisions to improve efficiency and reduce costs throughout the supply chain. Using this dashboard project we will try to touch all fundamental topics of data analysis using Power BI, SQL, and Python. Let’s start. Access dataset here.
Flow of the Project
- Project Architecture
- Project BRD or FRD Documents
- Data Gathering
- Data Cleaning / Data Transformation
- Data Modeling
- Mockup Preparation
- DAX Functions (DAX Calculations)
- Create Visuals (For Dashboard)
- Add Navigation
Project Architecture

Data Gathering
According to the BRD document, we have to connect the MySQL database with Kaggle APIs and bring data automatically into database by writing some python code. After then from database to the Power BI Desktop using ‘Get Data’ option. First we will gather and manipulate data using Pandas library in python.
Firstly go to the Kaggle website dataset name, ‘Supply chain management for Car‘ you can access it here. For python code we are going to use Jupyter notebook. Install the below libraries first.
#!pip install pandas
#!pip install zipfile
#!pip install kaggle
#!pip install numpy
#!pip install pymysql
Note: Kaggle need to store authentication token into a folder ‘.kaggle’ so follow the documentation below on How To Use Kaggle.
Below is the python code showcasing how to download dataset from Kaggle to your local and then by using pandas library read the dataset. We also have to put that data into MySQL database using python and then from database to Power BI Desktop using ‘Get Data’ option.
# import the pandas library
import pandas as pd

# import zipfile library (we will use this to extract the file downloaded from Kaggle)
import zipfile

# import kaggle library (we will use this to download the dataset programatically from Kaggle)
import kaggle

# download dataset from kaggle using the Kaggle API
!kaggle datasets download -d prashantk93/supply-chain-management-for-car

# extract the file from the downloaded zip file
zipfile_name = 'supply-chain-management-for-car.zip'
with zipfile.ZipFile(zipfile_name, 'r') as file:
    file.extractall()

# read in the csv file as a pandas dataframe
cars = pd.read_csv("Car_SupplyChainManagementDataSet.csv")

# check information
cars.info()

# check shape
cars.shape

# writing the final dataframe to an excel file that we will use in our Power BI visualisations.
cars.to_excel('supply-chain-final.xlsx', sheet_name='Data')

# Now connect to the MySQL database and put all the data into database
import numpy as np
import pymysql

myconnection = pymysql.connect(host='host_name', user='youser_name', passwd='your_password', database='your_db_name')

cur = myconnection.cursor()

df = pd.read_excel('supply-chain-final.xlsx')

# Remove the first unwanted column using iloc
df = df.iloc[:, 1:]

# Check the number of columns in your DataFrame
num_cols = len(df.columns)

# Generate a string with the same number of placeholders as the number of columns
placeholders = ','.join(['%s'] * num_cols)

# create a new table into the database and insert the data.
cur.execute("create table cars (SupplierID text, SupplierAddress text, SupplierName text, SupplierContactDetails text, ProductID text, CarMaker text, CarModel text, CarColor text, CarModelYear text, CarPrice text, CustomerID text, CustomerName text, Gender text, JobTitle text, PhoneNumber text, EmailAddress text, City text, Country text, CountryCode text, State text, CustomerAddress text, OrderDate text, OrderID text, ShipDate text, ShipMode text, Shipping text, PostalCode text, Sales text, Quantity text, Discount text, CreditCardType text, CreditCard text, CustomerFeedback text)")

sql = "INSERT INTO cars VALUES ({})".format(placeholders)

# convert every record/row into tuple and commit it.

for i in range(len(df)):
    cur.execute(sql, tuple(df.iloc[i]))
    myconnection.commit()
Use get data option to bring data into Power BI.
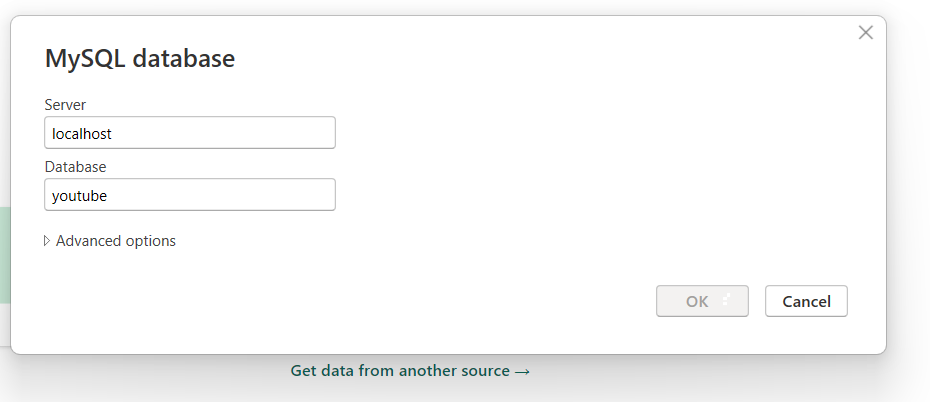
On MySQL database, we have database name as ‘youtube’ inside which we created the table called ‘cars’.
Data Cleaning
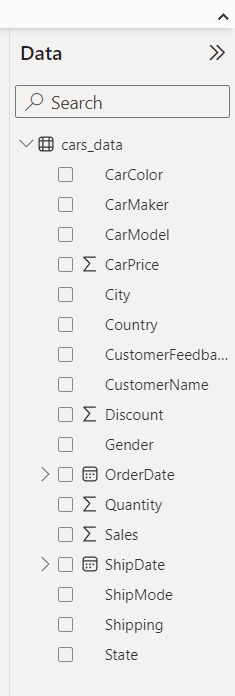
Let’s transform data on Power Query Editor, we need to remove some unnecessary attributes from the table and just keep the important columns which we can use for visualization. Below is the list of columns we are gonna work on, and rest of it has removed.
Apart from ‘cars_data’ table, we need to create a separate Calendar table (DateMaster). It is always a good practice to have a separate date table for time intelligence functions.
DateMaster = CALENDAR(MIN(cars_data[OrderDate]), MAX(cars_data[OrderDate]))OrderMonth Num = MONTH(DateMaster[OrderDate])
OrderMonth Name = FORMAT(DateMaster[OrderDate], "MMM")
OrderQuarter Num = QUARTER(DateMaster[OrderDate])Month Num = DateMaster[OrderDate].[MonthNo]Modeling In Power BI
After creating the date master table, establish the relationship between these two tables using modelling. Go to the model view tab and create one-to-many relationship between date columns in both the tables. Also create a new measure for ‘Total Sales’ and keep all the new measures in separate table called ‘DAX Measures’.
TotalSales = SUM(cars_data[Sales])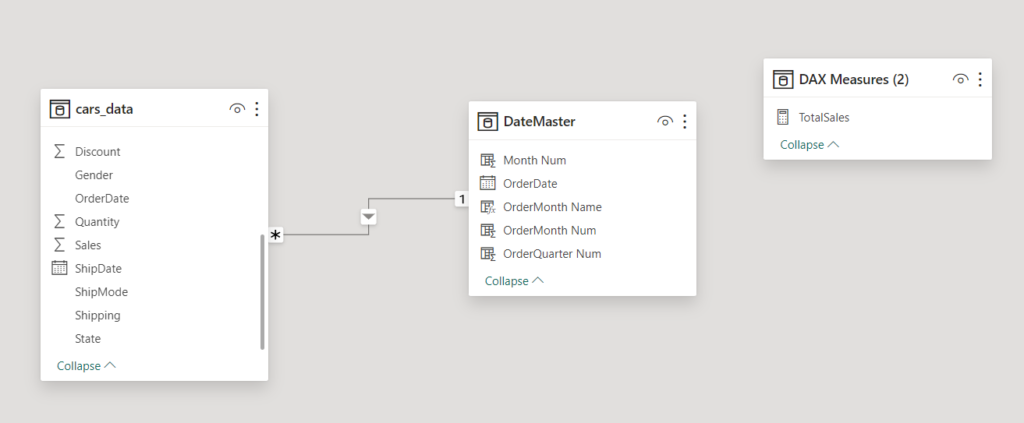
Before start creating the dashboard, we must spend some time on creating a prototype or mockup preparation. It is always a good practice to draw and imagine what to create on pen and paper first.
Dashboard Creation In Power BI
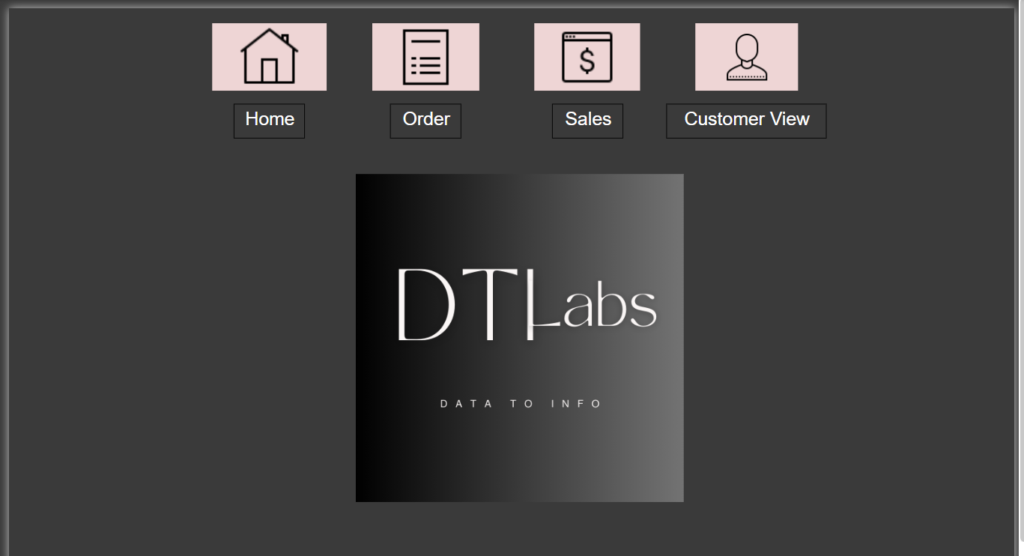
In our dashboard project, we are gonna create four different pages and implement navigation between all these four dashboard pages. The dashboard pages are Home, Order, Sales, and Customer View.
For our supply chain for cars project, on Home page we have navigation images and a company logo. After clicking the navigation images (ctrl + click) we can jump onto other pages of the project.
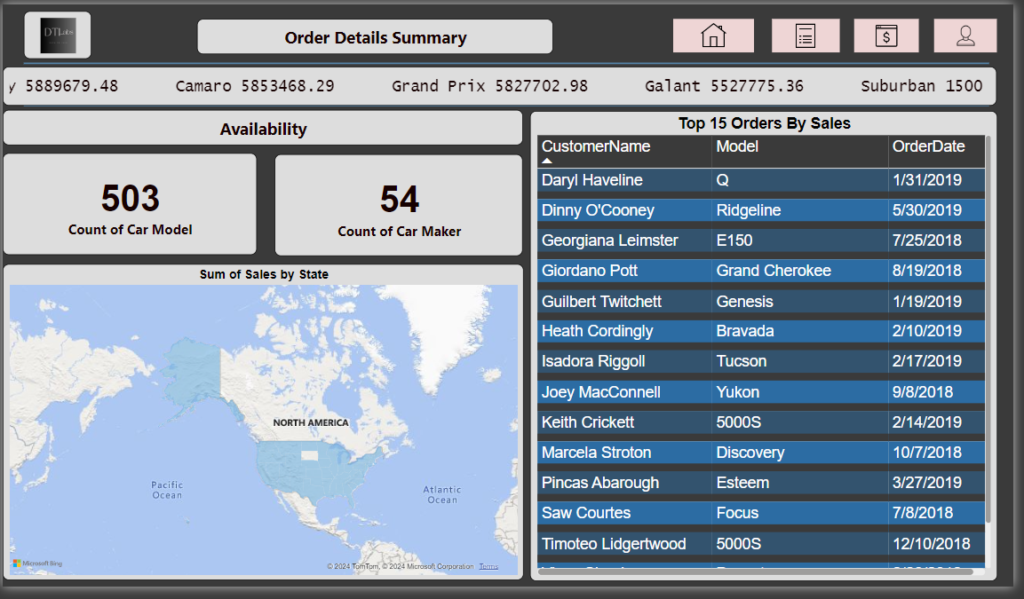
According to the BRD document, on Order page we have to show details related to the cars order. Show the availability of cars model and car makers. Also show the top 10 to 15 orders by sales, and finally create a map chart visual for sales or by state field. We have also added the new visual called scroller on top to show some car price by car model.
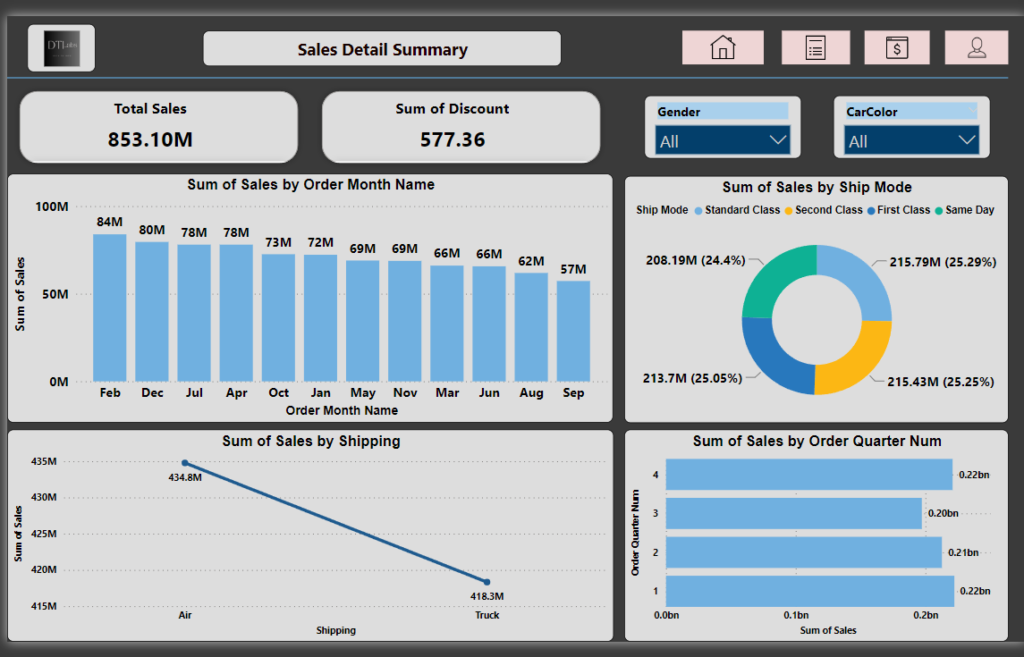
On Sales page according to requirement, show the total sales and discount values on card visuals. Also sales by month, sales by shipping, sales by ship mode, and sales by quarter using visuals column chart, line chart, donut chart, bar chart respectively. Here we added two slicers as well using Gender and CarColor columns which will act as a filter.
On Customer view page we have to show data related to the customers like show some sentiment analysis values using column chart visual. Customer names on a table visual. Also we have to create a drill down view on our supply chain model using decomposition tree visual.

Don’t forget to include the navigation images on every dashboard page. Now you have complete supply chain dashboard project with you. Please refer to the provided video for more detailed understanding. I hope you guys must have liked the dashboard project of supply chain management for cars in Power BI.
Overall, Supply Chain Management for Cars in Power BI empowers automotive companies to gain insights into their supply chain operations, improve collaboration with suppliers and partners, and ultimately deliver better products and services to customers.