Power BI Service is used to deployment of reports and creating dashboards also sharing your reports with other users.
Overview
It is SaaS (Software as a Service) part of PBI.
In Microsoft Power BI, the typical workflow involves crafting a report in Power BI Desktop, followed by publishing it to the Power BI service. Subsequently, the report is made accessible to consumers for viewing through the service or mobile app.
Within the Power BI service, there’s a feature that enhances distribution and simplifies consumption known as “apps.” An app serves as a means to organize related reports and dashboards, streamlining distribution to specific audiences. While more in-depth information about apps and the service will be covered in subsequent articles, it’s valuable to explore the experience to comprehend how apps can contribute to the efficiency of your organization.
Architecture
Below are the two flavors of architecture. Just a simple flow of power bi.

Explore Built-in Sample Reports
Effortlessly familiarize yourself with the Power BI service by exploring the pre-existing samples. Built-in samples consist of bundles that include one or more dashboards, semantic models, and reports, all accessible within the Power BI service.
Navigate to the Learning Center in the Power BI service from the left navigation pane. Choose a built-in sample from the available options, and it opens in Reading mode. Subsequently, Power BI imports the selected sample, appending a new report and semantic model to your My Workspace.
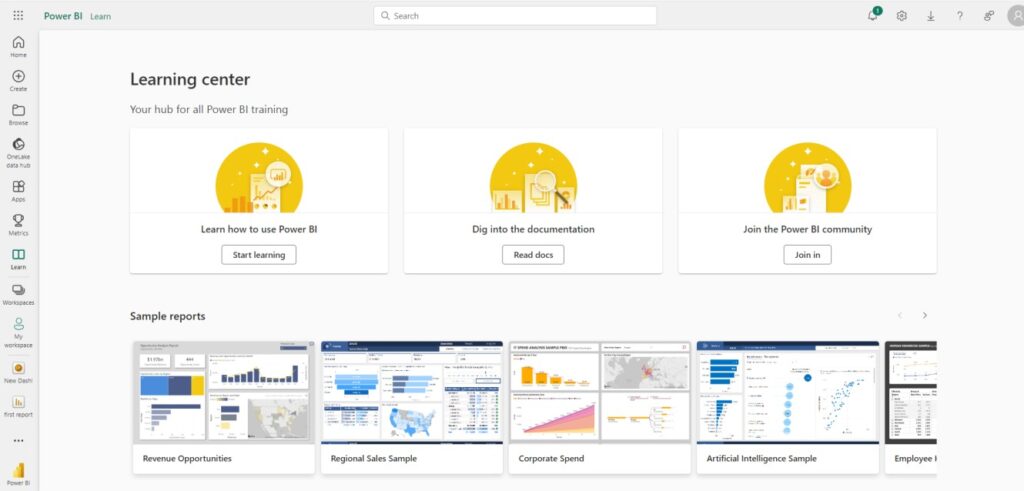
Once you’ve selected a sample report, you’ll be introduced to the firsthand experience of sharing reports with consumers. Pay attention to the Power BI service’s navigation pane and header, illustrated in the provided screenshot. Observe the collapsible features, such as the report navigation and filter pane, enhancing the overall accessibility and usability of the shared report.

Explore Template Apps
Now that you have a grasp of how reports can be shared via the Power BI service, let’s delve into the app experience. To provide a hands-on illustration, we’ll be using the GitHub template app to replicate and showcase this sharing experience.
To access template apps, select the Apps icon from the left navigation pane > Get apps > Template apps.
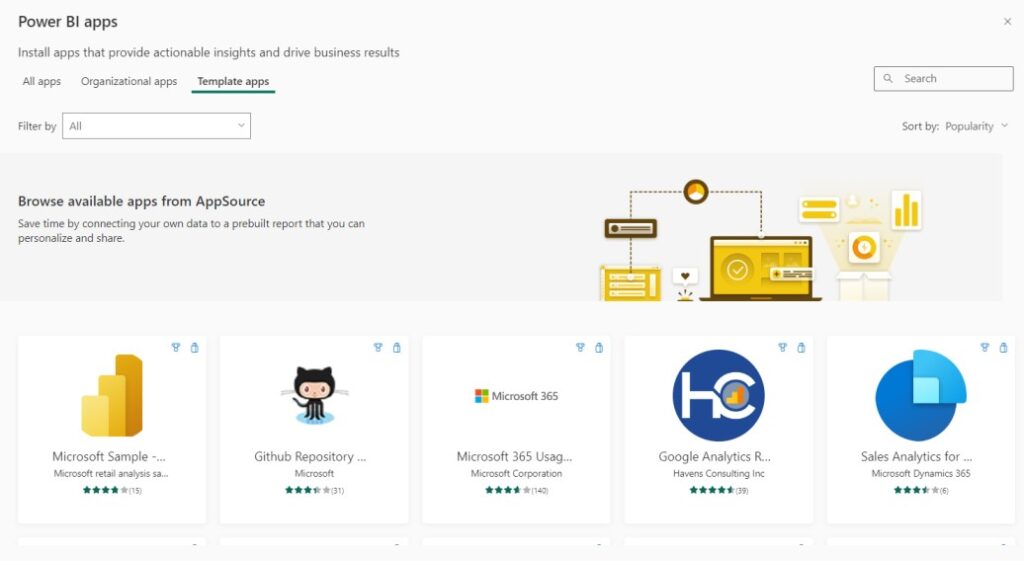
In the displayed screenshot, you’ll observe the absence of the Power BI service left navigation pane and header, which were evident in the direct report view. Additionally, take note of the dashboard and a multi-page report within the app navigation pane. The app interface offers a more streamlined appearance, featuring only the pertinent content. Furthermore, customization options, such as choosing the app color and thumbnail, are available. Apps also provide the flexibility to configure multiple audiences, allowing for restricted access to specific pages within a report, if needed.

All of the visuals are interactive and interacting with one visual filters the others accordingly. For example, when you select on mihart in the donut chart on the Top 100 Contributors report, all other visuals only show related data for mihart.

What is Workspace
Workspace in power bi service nothing but a folder to manage list of reports, dashboards, and semantic models. We can create multiple workspaces and share them with others.
Refresh Data in the Power BI Service
Likely, your data changes regularly, so Power BI accounts allows on-demand and scheduled semantic model refreshes. From the app workspace, you manually refresh or schedule up to eight refreshes per day at minimum.
Navigate to the Settings page and select the “Semantic Models” tab. Once there, in the right pane, click on the arrow adjacent to “Scheduled refresh” to expand this section. This action triggers the appearance of the Settings dialog box on the canvas, providing you with the option to configure the update settings according to your specific requirements.
The Power BI service provides a simple and interactive user experience to take your data analytics to the next level.