This is a comprehensive article that guides you through building an end-to-end data engineering solution on Microsoft Azure, specifically tailored for the healthcare domain. This project focuses on managing and analyzing healthcare revenue cycle data using various Azure services like Azure Data Factory (ADF), Azure Databricks, Storage Account, Delta Tables plus medallion architecture pattern for building pipeline.
Project Overview
The project’s primary objective is to construct a robust data warehousing solution tailored for healthcare data. This encompasses the extraction of data from diverse sources, its transformation and loading into a centralized repository, and the subsequent analysis to derive actionable insights. All the codes are given here.
Technologies and Tools Employed
The project leverages a suite of Azure services and tools to build the data pipeline:
- Azure Data Factory (ADF): Serves as the backbone for orchestrating data workflows, facilitating the extraction, transformation, and loading (ETL) processes from various data sources.
- Azure Data Lake Storage: Acts as a scalable storage solution for raw and processed data, accommodating both structured and unstructured datasets.
- Azure SQL Database: Functions as the staging and transformation area where data undergoes cleansing and structuring before being loaded into the data warehouse.
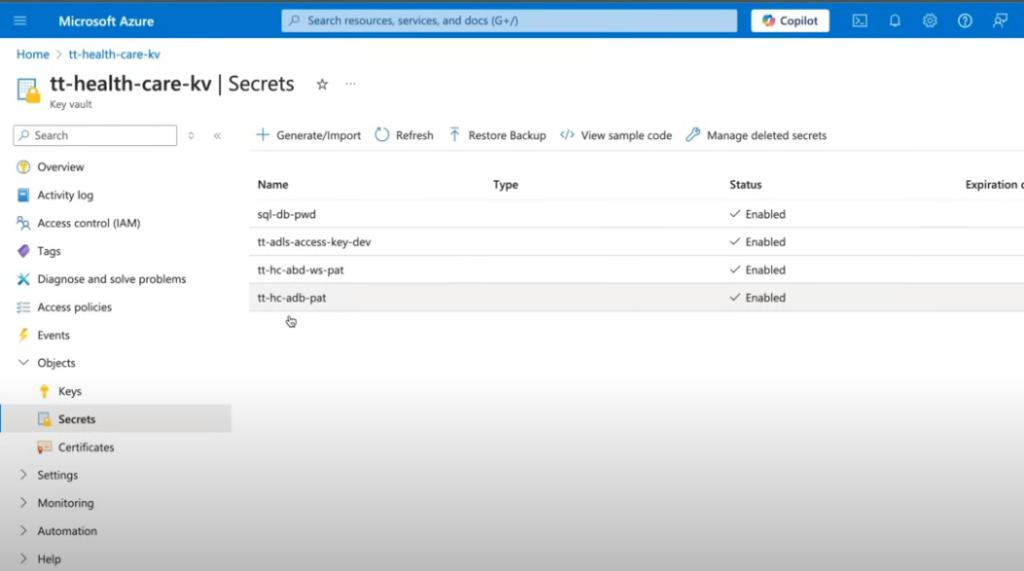
- Azure Key Vault: Ensures the secure management of secrets and credentials used across the data pipeline.
- Azure Databricks: Used to write medallion architecture codes in notebooks for data processing where all the other team members can collaborate and contribute.
What we have to do ?
We gonna use Azure Data Engineering Tech Stack for our project. The domain is healthcare in which we are using Healthcare Revenue Cycle Management (RCM) data. RCM is the process that hospitals use to manage the financial aspects, from the time the patient schedules an appointment till the time provider gets paid.
Here is a simplified breakdown:
- It starts with a patient visit: patient details and insurance details are collected
- Services are provided
- Billing happens: The hospital will create a bill
- Claims are reviewed: Insurance company review the bill and they might accept it or pay in full, or partial or decline.
- Payments and follow-ups, if partial payment is done by insurance company
- Tracking and improvement: RCM ensures the hospital can provide quality care while also staying financially healthy
As part of RCM we have two main aspects such as Accounts Receivable (AR) and Accounts Payable. Remember patient paying is often a risk, because there are some terms such as Low Insurance schemes put burden on patients. So the main objective of AR is to collect money from patient in less time period. The probability of collecting your full amount decreases with time.
There are some KPIs to measure AR and set benchmarks. Example, if AR > 90 days then 200K USD older than 90 days so if bill is 1 million then (200k/1M) = 20% less amount. what do we have to do as a Data Engineering, we will have data in various sources, we need to create a pipeline, the result of this pipeline will be fact tables and dimension tables, and this will help the reporting team to generate the KPI.
We have to create metadata driven pipeline using config file named as load_config.csv. It has database name, data source name, table name, load type (for loading data incrementally or full), watermark (it is based on load type), is_active (flag to run the pipeline for each record) and target path columns. This metadata will help us to run the pipeline. After reading this config file the system knows what to do and how to do.
Project Dataset
The project encompasses various datasets that represent different aspects of healthcare data:
1 – Electronic Medical Records (EMR) Data:
- Patients
- Providers
- Departments
- Transactions
- Encounters
These datasets are stored in Azure SQL Database and are ingested into the data pipeline for processing.
2 – Claims Data:
- Represents insurance claims information.
- Provided as flat files (e.g. CSV) and placed in the landing zone of Azure Data Lake Storage Gen2.
3 – National Provider Identifier (NPI) Data:
- Fetched via public APIs and stored in the bronze layer of the data lake.
- Contains information about healthcare providers.
4 – International Classification of Diseases (ICD) Codes:
- Retrieved through APIs and stored similarly to NPI data.
- Standardized codes for diagnoses.
5 – Current Procedural Terminology (CPT) Codes:
- Provided as flat files and processed into the data lake.
- Standardized codes for medical procedures.
Data Processing Layers
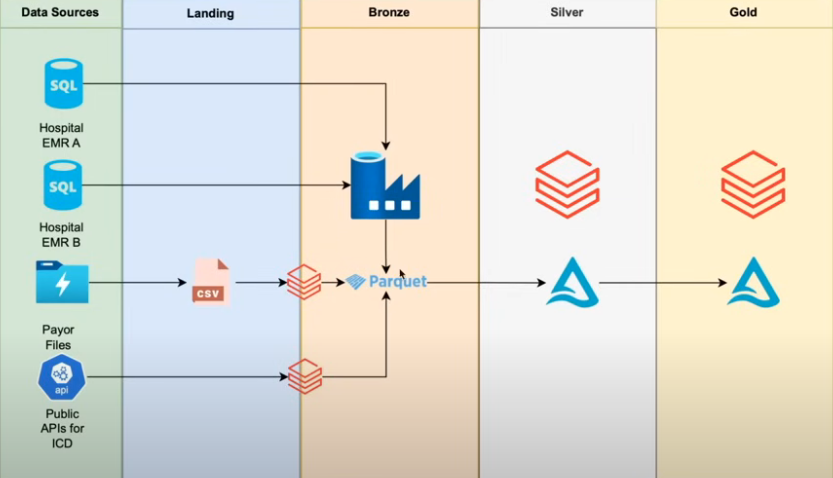
The project follows the Medallion Architecture, organizing data into three layers:
- Bronze Layer:
- Raw data ingestion.
- Data is stored in Parquet format.
- Silver Layer:
- Data cleansing and transformation.
- Implementation of Slowly Changing Dimensions (SCD) Type 2 for tracking historical changes.
- Data stored in Delta Lake format.
- Gold Layer:
- Aggregated and business-ready data.
- Creation of fact and dimension tables for reporting and analytics.
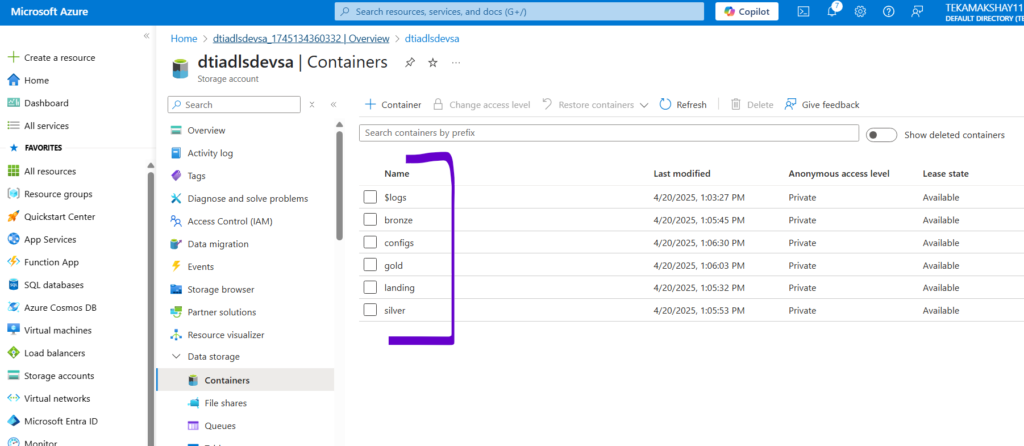
All the containers are here:
The compute cluster from Databricks:

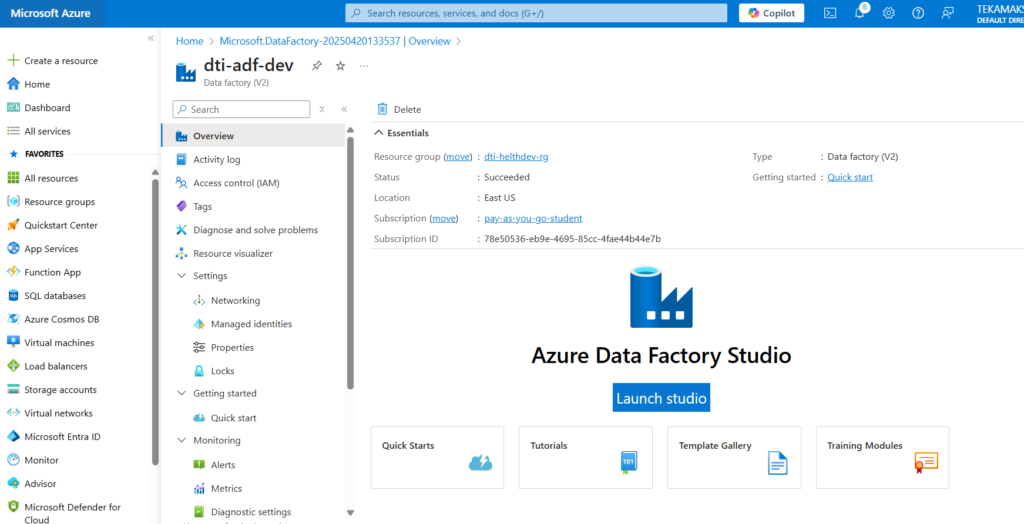
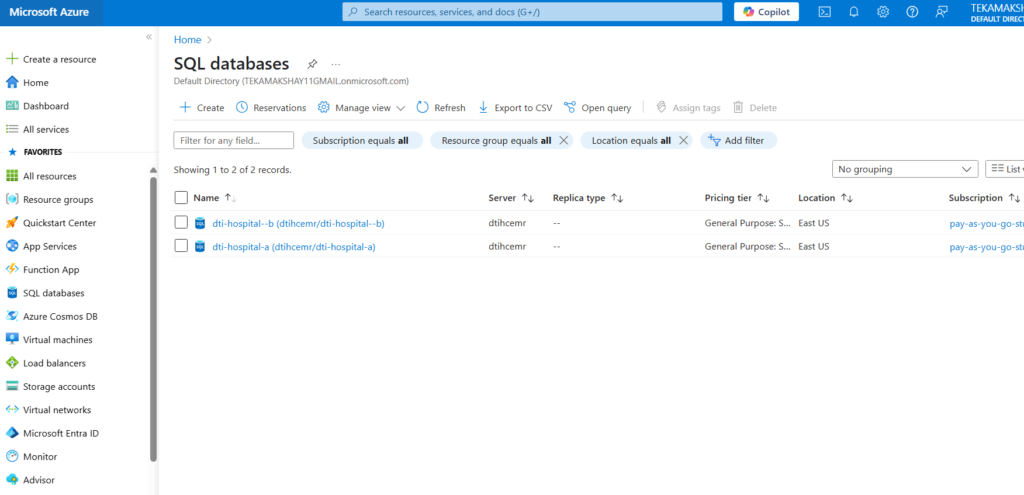
This is Azure data factory and Azure SQL DB and server:
Solution Architecture
The Medallion Architecture plays a central role in structuring the data pipeline in this Healthcare Azure Data Warehousing Project. It’s a best practice framework widely used in data engineering—especially with Azure + Databricks—to organize data in progressive layers: Bronze, Silver, and Gold. It’s a layered architecture that organizes data processing in three stages.
Bronze Layer – Raw Data Ingestion
- Source Data:
- From SQL DB, APIs (ICD, NPI), and CSV files (CPT, Claims)
- Storage:
- Stored in Azure Data Lake Storage Gen2 in Parquet format
- Purpose:
- Retain the raw, unprocessed data for traceability and auditability
- Tools Used:
- ADF for copying raw data
- Data ingested into Databricks as external tables
Silver Layer – Cleansed and Enriched Data
- Transformation:
- Clean nulls, fix schema issues, standardize formats
- Join datasets (e.g., claims with patient or provider info)
- Apply SCD Type 2 logic for dimensions (track changes)
- Storage:
- Stored as Delta tables (with ACID compliance)
- Purpose:
- Ready for analytics but still granular
- Acts as a reliable “single source of truth”
- Tools Used:
- Azure Databricks + PySpark
- Business logic written in Notebooks
Gold Layer – Aggregated Business-Level Data
- Aggregation:
- Metrics like total claims per department, average cost per diagnosis, etc.
- Data models built as fact and dimension tables
- Purpose:
- Ready for consumption in Power BI dashboards
- Optimized for business queries and reports
- Tools Used:
- Databricks for final aggregation
- Power BI connected to Gold layer Delta tables or Synapse
So our end goal is to create Fact and Dimension tables in gold layer so that our reporting team can use it.
Star Schema: Fact & Dimension Modeling
data modeling is done using a star schema approach involving fact and dimension tables in the Gold layer of the Medallion Architecture. This is essential for building efficient, scalable, and analytical-ready datasets.
Fact Tables – Contain measurable data (quantitative metrics)
Dimension Tables – Contain descriptive data (attributes to slice/dice the facts)
The Star Schema will look something like below diagram:

We will create a generic pipeline to bring EMR data to the bronze layer using ADF for ingestion. All the raw files and parquet files will be stored in Storage Account. All the credentials will be stored in Key Vault. Azure SQL DB will have ERM data, so we will create two databases for hospital-a and hospital-b. We also have config file in our ADLS storage to create metadata driven architectural pipeline.
Project Data Ingestion Pipeline
In this Healthcare Azure Data Warehousing Project, Azure Data Factory (ADF) acts as the orchestration tool, managing the movement and scheduling of data across different layers of the Medallion architecture. We will create Linked Services to connect with SQL Databases, ADLS, Azure Databricks Delta Lake, and Azure Key Vault. Plus we are creating a Audit table so that pipeline can start and stop incrementally using timestamp and gather new data after the timestamp.
So first we are bringing EMR data from Azure SQL DB to Storage Account bronze container in parquet format. So we have to create a ADF pipeline for this. To do all this we gonna need Linked Service, Datasets, Activities and Pipeline components in ADF.
Linked Service:
In Azure Data Factory (ADF), a Linked Service is like a connection string. It’s used to define the connection information for ADF to access external resources (e.g., databases, data lakes, APIs, etc.).
In this project, several Linked Services are configured to connect to different data sources and targets.

1. Azure SQL Database (Source)
- Linked Service Name: AzureSqlDatabase1
- Used in: Copy Activity (to bring
Patient,Provider,Claims, etc.). This single linked service is used to connect to two EMR databases. - Authentication: SQL Auth
- Purpose: Bring data from SQL database to Storage Account container.
2. Azure Data Lake Gen2 (Target Storage)
- Linked Service Name: AzureDataLakeStorage1
- Used in:
- Copy Activity (store raw and transformed data)
- Sink in data movement
- Authentication: Azure Key Vault / Managed Identity
- Purpose: Destination for Bronze → Silver → Gold data files (Parquet/Delta)
3. Databricks Workspace (Notebook Execution, Delta Lake)
- Linked Service Name: AzureDatabricksDeltaLake1
- Used in: Notebook Activity
- Authentication: Access token or Managed Identity
- Purpose: Trigger notebooks for data transformation logic and audit table in delta tables
4. Azure Key Vault (for secrets)
- Linked Service Name: LS_KeyVault
- Used to: Store secrets like:
- SQL DB credentials
- API keys
- Databricks access tokens
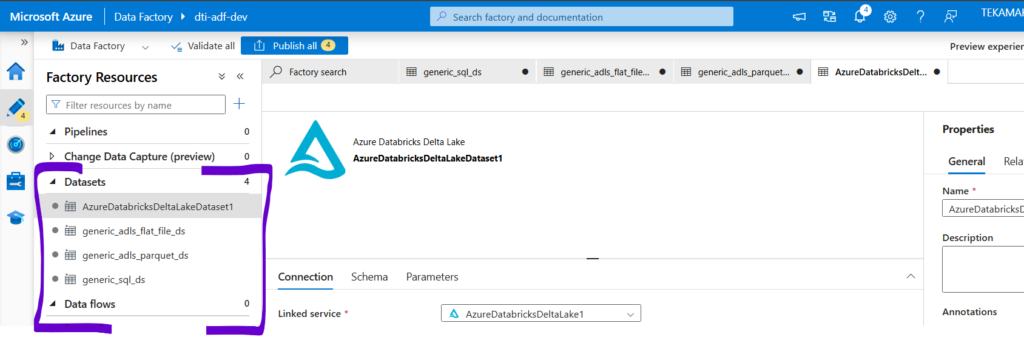
ADF Datasets:
In ADF, we have to create datasets for our linked services and provide the file path. So the generic dataset looks like below where container name, database name, schema name, table name, file name will be provided dynamically.
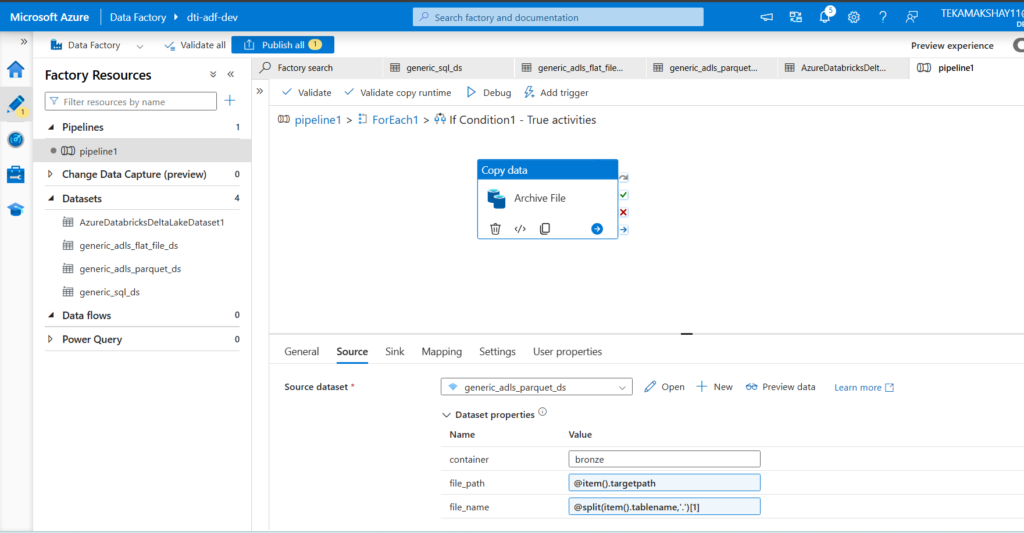
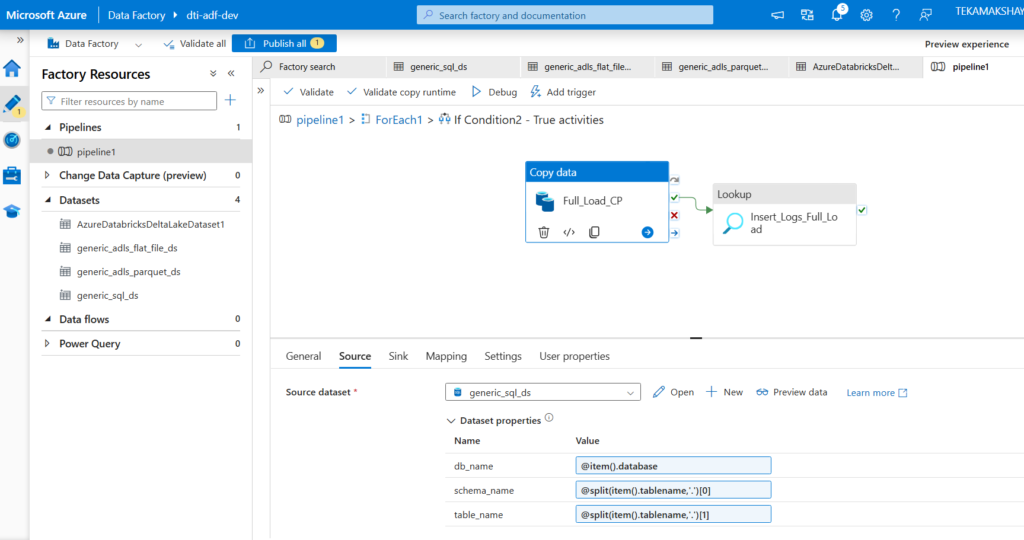
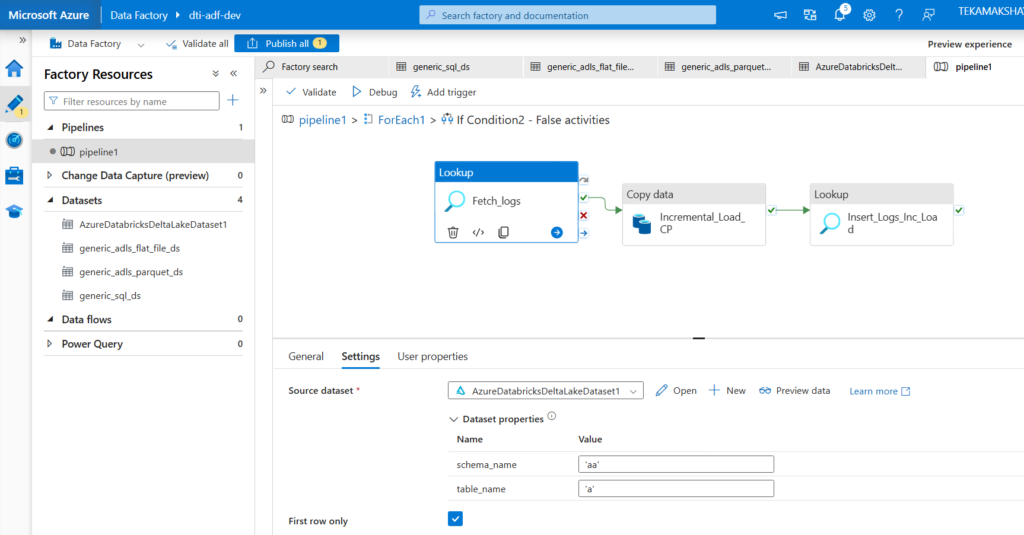
Now in ADF, we will create the pipeline and have activities inside them. First we create the Lookup activity (Lkp_EMR_Configs) which will look for files in our case config file. We have that file in container location (configs/emr/load_config.csv). The second activity is ForEach activity, so for each entry in the file we want to do some task. So pipeline first checks whether file exists or not using Get Metadata activity in ForEach. Inside ForEach we have Get Metadata, and two if condition activities. inside if condition activity we have copy data activity to copy data from source to sink means archiving the file. And if it is archive, then we have to take the data from SQL DB and put in bronze container. The second if condition is for loadtype, which means full or incremental data load.
The audit table creation code looks like this:
CREATE TABLE IF NOT EXISTS audit.load_logs (
    id BIGINT GENERATED ALWAYS AS IDENTITY,
    data_source STRING,
    tablename STRING,
    numberofrowscopied INT,
    watermarkcolumnname STRING,
    loaddate TIMESTAMP
);
Below is the Ingestion Pipeline detailed activity view to get EMR data from Azure SQL DB to ADLS Storage:


So far we have collected the EMR data through ADF ingestion pipeline. Now we have to collect claims data into the landing zone container. So in landing zone we will have flat csv files, in bronze layer we will have parquet files and in silver and gold layers will have delta tables. CPT codes data also assume it to be stored in landing zone from third party as flat csv files. Also NPI and ICD codes data we will directly put from landing zone to bronze layer.
Now go to the Azure Databricks and create the catalog (tt_hc_adb_ws) in your workspace. Create the schema inside it with name audit and then table called load_logs. Next we write codes to create mount points for bronze, silver, gold, landing and config folders inside storage account. We will use key vault here to access ADLS access key and Databricks.
Now we have to write the silver and gold layer codes to transform data and do some data modeling to create fact and dimension tables for reporting. All the codes are given here.