
In the realm of data analysis, outliers are data points that deviate significantly from the majority of the observations in a dataset. These observations can have a significant impact on statistical analysis, leading to biased results and misleading interpretations. Therefore, it is crucial to identify and appropriately deal with outliers to ensure accurate and reliable data analysis. In this article, we will explore the concept of outliers, their potential causes, and various techniques to handle outliers effectively.
What is Outliers
Outliers can manifest in different forms, such as unusually high or low values, extreme data points, or observations far from the mean or median. These outliers may arise due to various reasons, including measurement errors, data entry mistakes, natural variation in the data, or even genuine anomalies in the underlying phenomena being studied.
Impact of Outliers:
Outliers can heavily influence statistical measures, such as the mean and standard deviation, leading to skewed results. They can also affect regression models, clustering algorithms, and other data analysis techniques that assume a normal distribution or rely on distance metrics. Ignoring outliers or handling them incorrectly can distort the interpretation of the data and produce inaccurate conclusions.
Detecting Outliers
Before dealing with outliers, it is essential to identify them. Some common approaches for outlier detection include:
1 – Visualizations:
Box plots, scatter plots, and histograms can reveal the presence of outliers by showing data points that fall far outside the expected range.
- Box plots: Consider a dataset of exam scores from a class of students. The box plot can help identify any unusually high or low scores that deviate from the majority of the data.
import matplotlib.pyplot as plt
import seaborn as sns

# Sample exam scores
scores = [72, 78, 85, 88, 90, 92, 95, 98, 99, 105, 110]

# Create a box plot
sns.boxplot(x=scores)

# Set plot labels
plt.xlabel('Exam Scores')
plt.title('Box Plot of Exam Scores')

# Display the plot
plt.show()
In this example, the box plot visually displays the distribution of exam scores. Any data points falling above the upper whisker or below the lower whisker can be considered outliers.

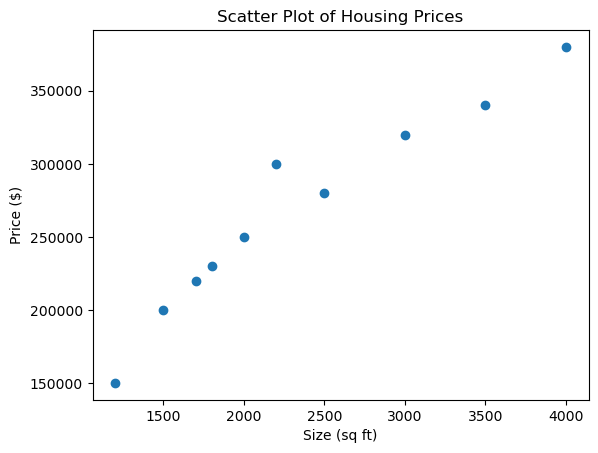
- Scatter plots: A scatter plot displays individual data points as dots on a graph, with one variable plotted on the x-axis and another on the y-axis. This visual representation allows us to observe patterns, trends, and relationships between the two variables. Scatter plots are particularly useful for detecting outliers because they highlight data points that deviate from the overall distribution.
Let’s consider an example where we have a dataset of housing prices and their corresponding sizes (in square feet). We want to identify potential outliers using a scatter plot.
import matplotlib.pyplot as plt

# Generate example data
sizes = [1200, 1500, 1700, 1800, 2000, 2200, 2500, 3000, 3500, 4000]
prices = [150000, 200000, 220000, 230000, 250000, 300000, 280000, 320000, 340000, 380000]

# Create scatter plot
plt.scatter(sizes, prices)
plt.xlabel('Size (sq ft)')
plt.ylabel('Price ($)')
plt.title('Scatter Plot of Housing Prices')
plt.show()
In the scatter plot above, we can visually identify any data points that are significantly distant from the main cluster. These points could potentially be outliers that require further investigation.
- Histograms: A histogram is a graphical representation of data that displays the distribution of values across different bins or intervals. The x-axis represents the range of values, divided into bins, and the y-axis shows the frequency or count of observations falling within each bin. By examining the shape and spread of the histogram, we can gain insights into the distribution and identify potential outliers.
import matplotlib.pyplot as plt

heights = [160, 165, 170, 168, 175, 172, 169, 180, 190, 195, 155, 2000]

plt.hist(heights, bins=10)
plt.xlabel('Height')
plt.ylabel('Frequency')
plt.title('Histogram of Heights')
plt.show()
The resulting histogram would show most of the bars clustered together for the majority of the heights, while one bar at the far right represents the outlier value of 2000. This outlier significantly impacts the visualization and distorts the understanding of the distribution.

2 – Summary Statistics:
Calculating measures like the z-score, and IQR values which helps to understand how far a data point is away from the mean, and can help identify outliers.
- Z-Score Method: The Z-score method identifies outliers based on how far a data point deviates from the mean in terms of standard deviations. Data points with a Z-score above a certain threshold (e.g., 2 or 3) are considered outliers.
import pandas as pd
import numpy as np

# Create a DataFrame with a numerical variable
data = {'Values': [10, 12, 15, 14, 13, 200]}
df = pd.DataFrame(data)

# Calculate the Z-score for each data point
z_scores = np.abs((df['Values'] - df['Values'].mean()) / df['Values'].std())

# Set a threshold for outlier detection (e.g., Z-score > 3)
threshold = 3

# Identify outliers
outliers = df[z_scores > threshold]

print(outliers)
     Values
5     200
In this example, the Z-score is calculated for each data point in the ‘Values’ column. The threshold for outlier detection is set to 3, and any data point with a Z-score greater than 3 is considered an outlier. In this case, the value 200 is identified as an outlier.
- IQR (Interquartile Range) Method: The IQR method identifies outliers based on the range between the 25th and 75th percentiles (IQR). Data points outside a certain range (typically defined as 1.5 times the IQR) are considered outliers.
import pandas as pd

# Create a DataFrame with a numerical variable
data = {'Values': [10, 12, 15, 14, 13, 200]}
df = pd.DataFrame(data)

# Calculate the IQR for the 'Values' column
Q1 = df['Values'].quantile(0.25)
Q3 = df['Values'].quantile(0.75)
IQR = Q3 - Q1

# Set a threshold for outlier detection (e.g., 1.5 times IQR)
threshold = 1.5

# Identify outliers
outliers = df[(df['Values'] < Q1 - threshold * IQR) | (df['Values'] > Q3 + threshold * IQR)]

print(outliers)
In this example, the IQR is calculated for the ‘Values’ column. The threshold for outlier detection is set to 1.5 times the IQR. Any data point outside this range is considered an outlier. The value 200 is identified as an outlier.
Dealing with Outliers
Once outliers have been detected, there are several strategies to handle them, depending on the context and the specific analysis goals. Here are some common techniques:
- Removal: In certain situations, outliers can be removed from the dataset if they are deemed to be errors or anomalies. However, caution should be exercised when removing outliers, as it may introduce bias and affect the overall representativeness of the data.
- Transformation: Applying mathematical transformations, such as logarithmic, square root, or reciprocal transformations, can mitigate the impact of outliers and make the data more normally distributed. This approach is particularly useful when outliers have a significant effect on the data distribution.
- Winsorization: Winsorization involves capping or truncating extreme values to a predetermined threshold. This approach limits the effect of outliers while still retaining some information from the original data.
- Imputation: If the outliers are suspected to be a result of measurement errors or missing data, imputation methods can be used to estimate the missing values based on the surrounding observations. Imputation can help preserve the overall structure of the dataset while reducing the impact of outliers.
- Robust statistical techniques: Utilizing statistical techniques that are less sensitive to outliers, such as median-based estimators or rank-based methods, can provide more robust analysis results. These techniques give less weight to extreme values, making them less susceptible to outliers.
Also Check Out: Data Processing Using Pandas
Conclusion
Dealing with outliers is a critical step in data analysis to ensure accurate and meaningful results. Detecting and appropriately handling outliers requires careful consideration of the data characteristics, analysis objectives, and domain knowledge. By implementing suitable techniques, such as outlier detection methods and outlier handling strategies, analysts can mitigate the impact of outliers and derive more accurate insights from their datasets. However, it is important to exercise caution and document the chosen approach to maintain transparency and reproducibility in data analysis workflows.