Dynamic reports are reports that offer flexibility, enabling developers to adjust data based on user specifications by creating single and multi valued parameters.
Overview
The versatility of dynamic reports is highly advantageous, as a single report can serve multiple purposes. Adopting dynamic reports reduces the need for creating numerous individual reports, ultimately saving organizational time and resources.
The incorporation of parameters is a key strategy in dynamic reporting. By defining the values for which you want to visualize data in the report, the report dynamically updates, filtering the data accordingly.
In the provided example, a report has been created for the Sales of Sample Super Store Dataset, showcasing sales data from the any source you like. While the report offers a comprehensive view of the Sales team’s performance, team members express the desire to filter the report, allowing them to exclusively view their individual data and monitor their performance and other details.
Parameters
Parameters are like container in which we can hold single and multiple values and we can use those parameters to create dynamic report. It can be used for transformation and custom functions.
Power BI allows you to use parameters to make your report dynamic.
A parameter serves as a way to easily store and manage a value that can be reused.
Create Dynamic Reports for Individual Values
To create a dynamic report, you first need to write your SQL query or go for manual given option. In this article we will go for manual option. So import your dataset into Power BI using Get Data option. We have Sample Super Store Dataset.
Steps are:
- Import data using Get Data option.
- Select Edit to open the data in Power Query Editor.
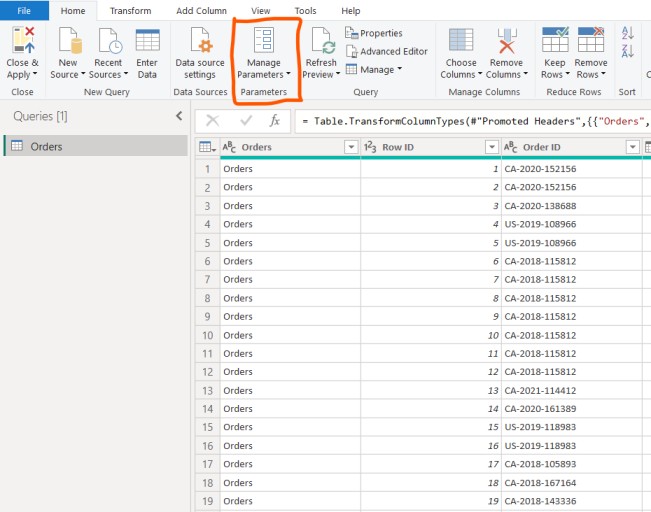
Next, you create the parameter by following these steps:
- On the Home tab, select Manage parameters > New parameter.
- On the Parameters window, change the default parameter name to something more descriptive so that its purpose is clear. In this case, you change the name to SalesStatesParameter.
- Select Text from the Type list and then select Any value from the Suggested value list.
- Select OK.
A dialog box will be open.

A new query is shown for the parameter that you created. It will look something like this.

Now, you need to adjust the code in SQL query to assess your new parameter using Advanced Editor option or you can do this step manually as well.
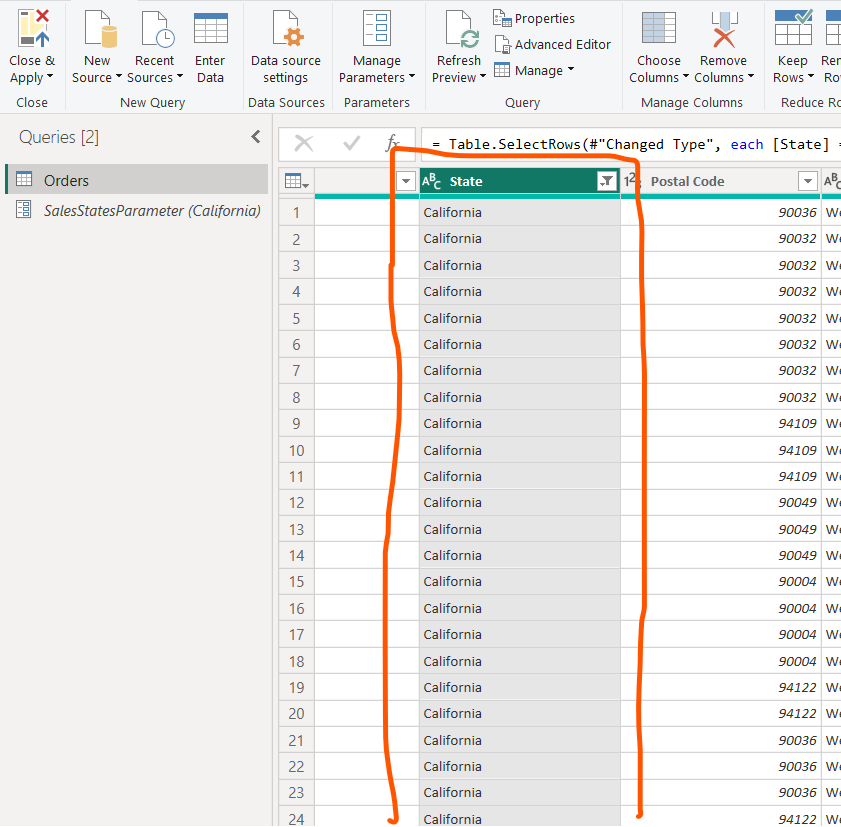
- Go to the original Orders sheet and put the ‘equal‘ filter on states column. Select your parameter from dropdown.

- Select Close and Apply to return to the report editor.
Now, you can apply the parameter to the report:
- Select Edit queries > Edit parameters.
- On the Edit Parameters window, enter a new value and then select OK.
- Select Apply changes and then run the native query again.
Now, when you view the data, you see the data for the new value that was passed through the parameter.
You can now create a report that displays data for one particular value at a time. More steps are needed to display data for multiple values at the same time.
Now you can create dynamic reports for multiple values in the same way. You just have to select ‘List of Values‘ option from suggested values dropdown in ‘Manage Parameters‘ dialog box.