
The goal of this project is to connect Snowflake to Power BI, pull data via SQL queries, and create basic dashboards (Sales by Region, Monthly Revenue Trends, Product Performance). For full SQL code you can refer to my GitHub page.
Prerequisites
Snowflake Account (Free trial or paid)
- Warehouse created (e.g.,
COMPUTE_WH) - Database and schema ready
- Sample data available (we’ll create a dummy data)
Power BI Desktop installed
Connection details from Snowflake:
- Server:
<your_account>.snowflakecomputing.com - Warehouse:
COMPUTE_WH - Database
- Schema
- Username & Password
Step 1: Prepare Data in Snowflake
We’ll use sample data for simplicity.
Create a Database & Schema
-- Create a Database & Schema
CREATE DATABASE IF NOT EXISTS SALES_DB;
USE DATABASE SALES_DB;

CREATE SCHEMA IF NOT EXISTS SALES_DB.SALES_SCHEMA;
USE SCHEMA SALES_SCHEMA;
Create a Sample Sales Table
-- Create a Sample Sales Table
CREATE OR REPLACE TABLE SALES_DB.SALES_SCHEMA.SALES_DATA (
    ORDER_ID INT,
    ORDER_DATE DATE,
    REGION STRING,
    PRODUCT STRING,
    QUANTITY INT,
    PRICE FLOAT
);

INSERT INTO SALES_DB.SALES_SCHEMA.SALES_DATA VALUES
(1, '2024-01-15', 'North', 'Laptop', 2, 1200),
(2, '2024-02-10', 'South', 'Mouse', 10, 15),
(3, '2024-02-20', 'East', 'Keyboard', 5, 30),
(4, '2024-03-05', 'West', 'Monitor', 3, 150),
(5, '2024-03-18', 'North', 'Laptop', 1, 1200);
Verify the data
SELECT * FROM SALES_DB.SALES_SCHEMA.SALES_DATA;Step 2: Enable Power BI Connection to Snowflake
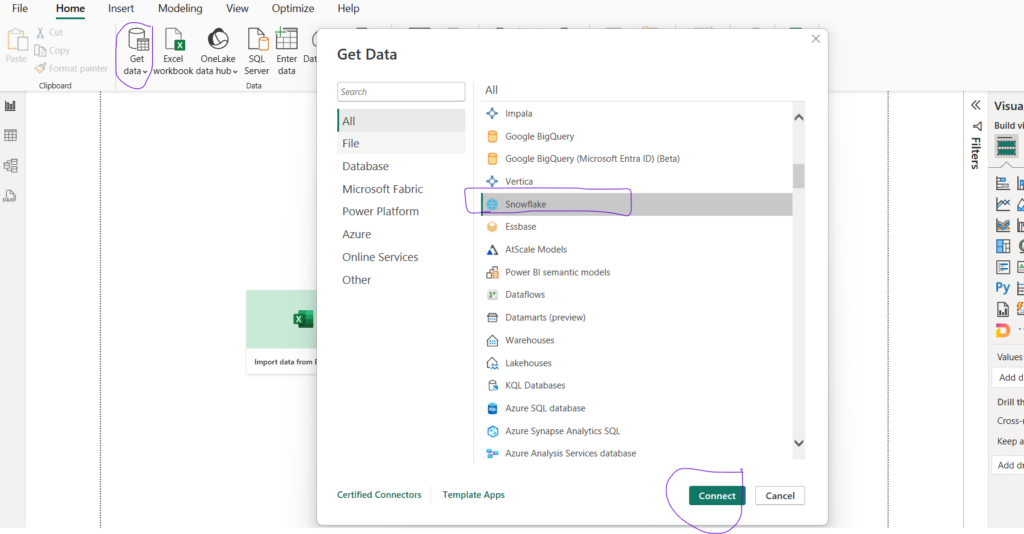
- Open Power BI Desktop.
- Go to Home > Get Data > Snowflake.
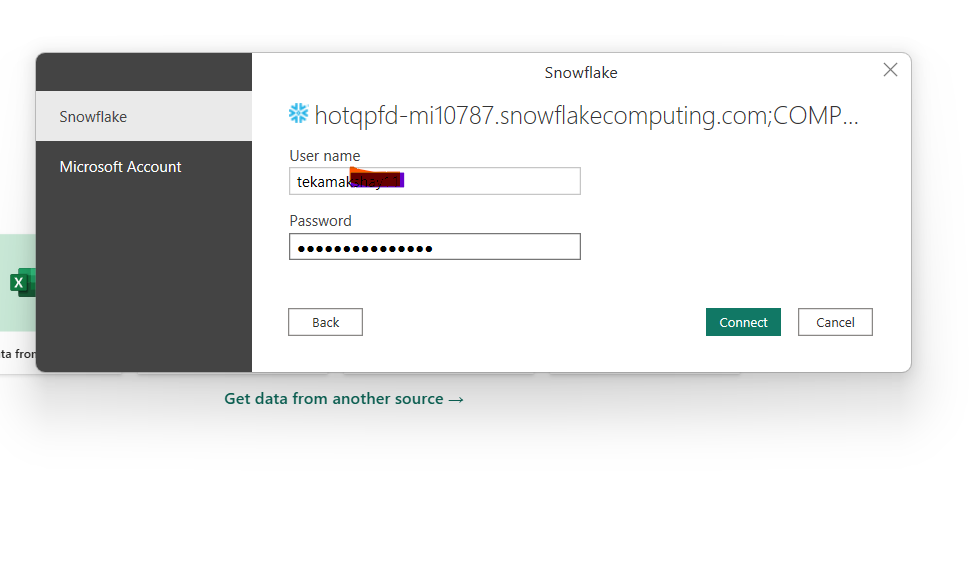
- Enter:
- Server:
<your_account>.snowflakecomputing.com - Warehouse:
COMPUTE_WH - Authentication: Username / Password.
Select your database & schema (e.g., SALES_DB.SALES_SCHEMA). Click Load (or use Transform to shape data in Power Query).
Step 3: Pull Data with Queries
Instead of importing entire tables, you can use DirectQuery or Import Mode. We will go with DirectQuery option.
Sales by Region
SELECT REGION, SUM(QUANTITY * PRICE) AS TOTAL_SALES
FROM SALES_DB.SALES_SCHEMA.SALES_DATA
GROUP BY REGION;
Monthly Revenue Trends
SELECT DATE_TRUNC('month', ORDER_DATE) AS MONTH,
       SUM(QUANTITY * PRICE) AS MONTHLY_REVENUE
FROM SALES_DB.SALES_SCHEMA.SALES_DATA
GROUP BY DATE_TRUNC('month', ORDER_DATE)
ORDER BY MONTH;
Product Performance
SELECT PRODUCT, SUM(QUANTITY) AS TOTAL_QUANTITY,
       SUM(QUANTITY * PRICE) AS TOTAL_REVENUE
FROM SALES_DB.SALES_SCHEMA.SALES_DATA
GROUP BY PRODUCT;
Now putting all these queries in power bi advance editor and writing M code for multiple queries is not possible, so instead we will create separate views of these statements and then load these views into the power bi using DirectQuery option as a separate tables. So don’t use the upper statement use the below three with views, write these views in snowflake and run first.
-- create View for Sales by Region
CREATE OR REPLACE VIEW SALES_DB.SALES_SCHEMA.SALES_BY_REGION AS
SELECT REGION,
       SUM(QUANTITY * PRICE) AS TOTAL_SALES
FROM SALES_DB.SALES_SCHEMA.SALES_DATA
GROUP BY REGION;

-- create View for Monthly Revenue Trends
CREATE OR REPLACE VIEW SALES_DB.SALES_SCHEMA.MONTHLY_REVENUE AS
SELECT DATE_TRUNC('month', ORDER_DATE) AS MONTH,
       SUM(QUANTITY * PRICE) AS MONTHLY_REVENUE
FROM SALES_DB.SALES_SCHEMA.SALES_DATA
GROUP BY DATE_TRUNC('month', ORDER_DATE)
ORDER BY MONTH;

-- create View for Product Performance
CREATE OR REPLACE VIEW SALES_DB.SALES_SCHEMA.PRODUCT_PERFORMANCE AS
SELECT PRODUCT,
       SUM(QUANTITY) AS TOTAL_QUANTITY,
       SUM(QUANTITY * PRICE) AS TOTAL_REVENUE
FROM SALES_DB.SALES_SCHEMA.SALES_DATA
GROUP BY PRODUCT;
Now while loading these views in power bi we can see the previews.
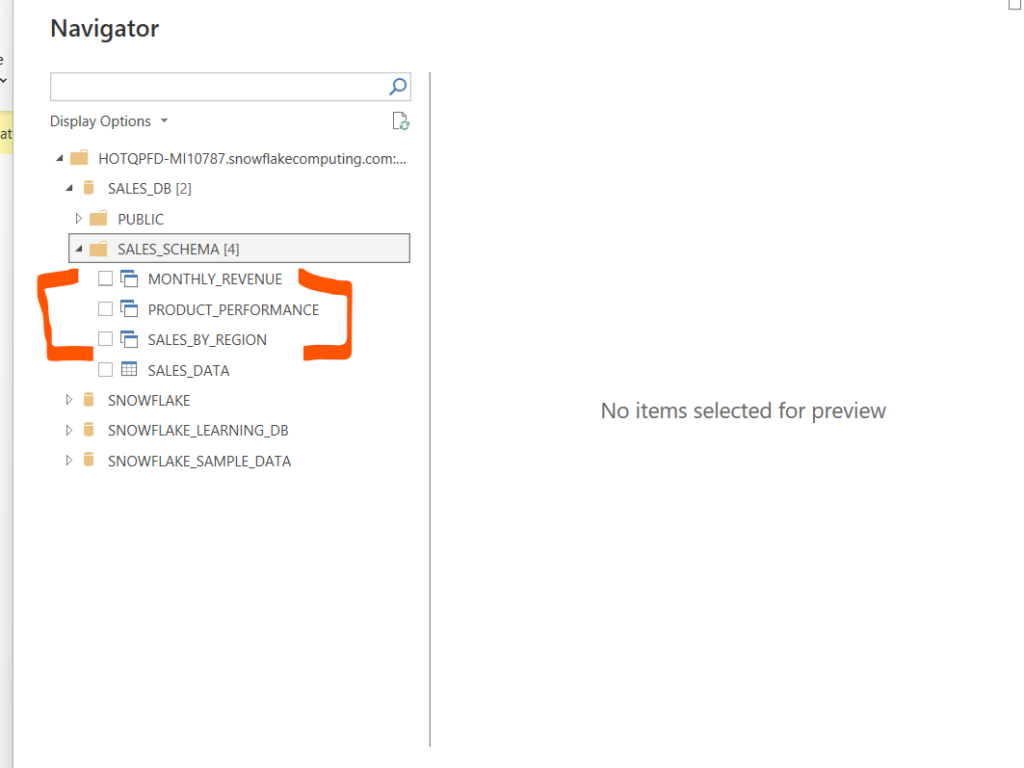
After loading these views using DirectQuery option, we can now create the power bi report using charts like bar chart, line chart, pie chart.
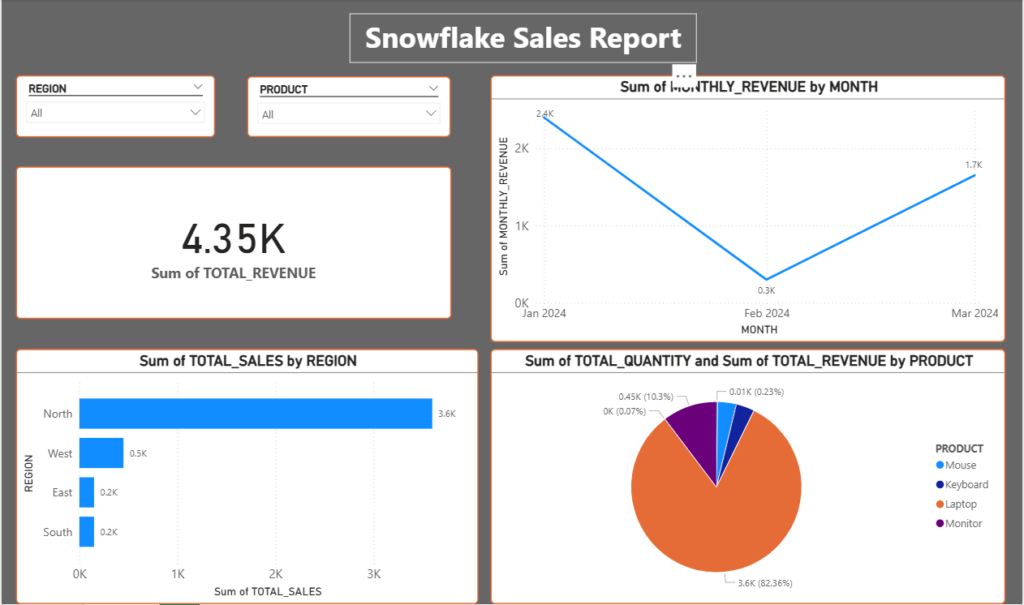
This is the snowflake beginners project for building basic reports on Power BI. Let me know your thoughts in comment down below.