This project is a data engineering pipeline solution to a made-up business problem, created to aid in my learning and understanding of data pipelining. We have Tech Stack as On-Prem SQL DB, Data Factory, Data Lake Gen 2, Databricks, Synapse Analytics, Power BI, Entra ID (Active Directory), Key Vault.
Project Overview
This project addresses a critical business need by building a comprehensive data pipeline on Azure. The goal is to extract customer and sales data from an on-premises SQL database, transform it in the cloud, and generate actionable insights through a Power BI dashboard. The dashboard will highlight key performance indicators (KPIs) related to gender distribution and product category sales, allowing stakeholders to filter and analyze data by date, product category, and gender. All the project codes are given here.
Business Requirements
The business has identified a gap in understanding customer demographics—specifically gender distribution—and how it influences product purchases. The key requirements include:
- Sales by Gender and Product Category: A dashboard showing the total products sold, total sales revenue, and a gender split among customers.
- Data Filtering: Ability to filter the data by product category, gender, and date.
- User-Friendly Interface: Stakeholders should have access to an easy-to-use interface for making queries.
Solution Overview
To meet these requirements, the solution is broken down into the following components:

- Data Ingestion:
- Extract customer and sales data from an on-premises SQL database.
- Load the data into Azure Data Lake Storage (ADLS) using Azure Data Factory (ADF).
- Data Transformation:
- Use Azure Databricks to clean and transform the data.
- Organize the data into Bronze, Silver, and Gold layers for raw, cleansed, and aggregated data respectively.
- Data Loading and Reporting:
- Load the transformed data into Azure Synapse Analytics.
- Build a Power BI dashboard to visualize the data, allowing stakeholders to explore sales and demographic insights.
- Automation:
- Schedule the pipeline to run daily, ensuring that the data and reports are always up-to-date.
Technology Stack
- Azure Data Factory (ADF): For orchestrating data movement and ingestion.
- Azure Data Lake Storage (ADLS): For storing raw and processed data.
- Azure Databricks: For data transformation and processing.
- Azure Synapse Analytics: For data warehousing and SQL-based analytics.
- Power BI: For data visualization and reporting.
- Azure Key Vault: For securely managing credentials and secrets.
- SQL Server (On-Premises): Source of customer and sales data.
Setup Instructions
Prerequisites
- An Azure account with sufficient credits.
- Access to an on-premises SQL Server database.
Step 1: Azure Environment Setup
- Create Resource Group: Set up a new resource group in Azure.
- Provision Services:
- Create an Azure Data Factory instance.
- Set up Azure Data Lake Storage with bronze, silver, and gold containers.
- Set up an Azure Databricks workspace and Synapse Analytics workspace.
- Configure Azure Key Vault for secret management.
Step 2: Data Ingestion
- Set up SQL Server: Install SQL Server and SQL Server Management Studio (SSMS). Restore the AdventureWorks database.
- Ingest Data with ADF: Create pipelines in ADF to copy data from SQL Server to the bronze layer in ADLS.

Now go to Azure Portal and create a new Resource Group, in which we will manage all the resources at once such as ADF, Data Lake, Databricks, Azure Synapse and Key Vault.
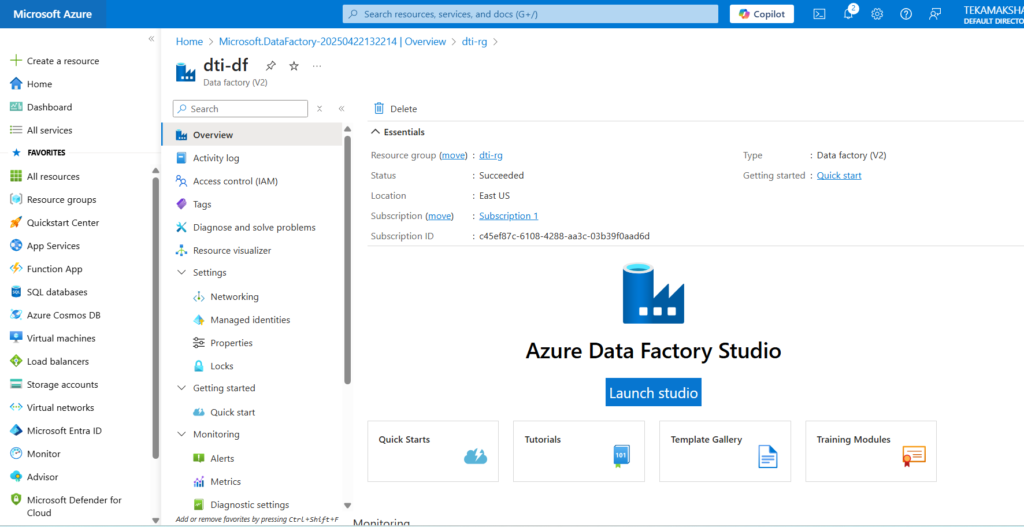
Just create the resource group with name as dti-rg and ADF in it with name dti-df.
Create Storage Account in the same resource group.

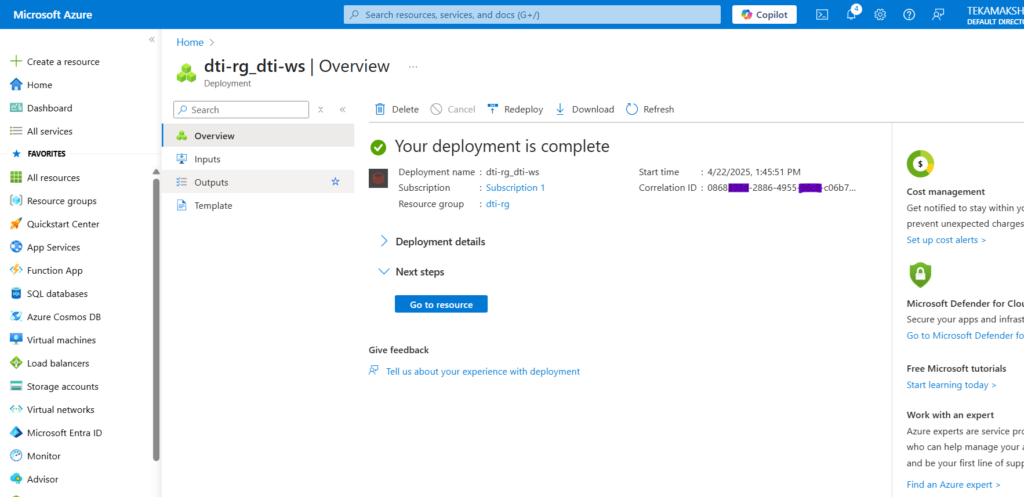
Create Azure Databricks workspace in the same resource group.
Create Azure Synapse in the same resource group.

Create all the required containers (bronze, silver, gold) in the ADLS storage account.

Create the key vault in the same resource group.


Now just go to the ADF studio and copy data from SQL server database to ADLS storage. Before this just create an IAM role for key vault administrator and for Key Vault Secrets User.

Also create the secret value for the key vault. After this go to the Azure Data Factory Studio and create the pipeline.
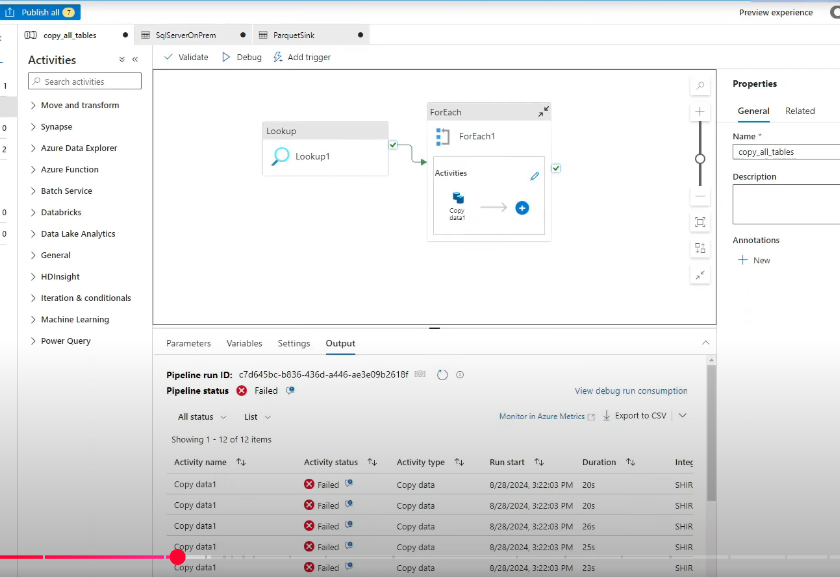
If the pipeline fails, try again and check connections. After we trigger the ingestion pipeline, it will copy all data to ADLS bronze container.

Step 3: Data Transformation
- Mount Data Lake in Databricks: Configure Databricks to access ADLS.
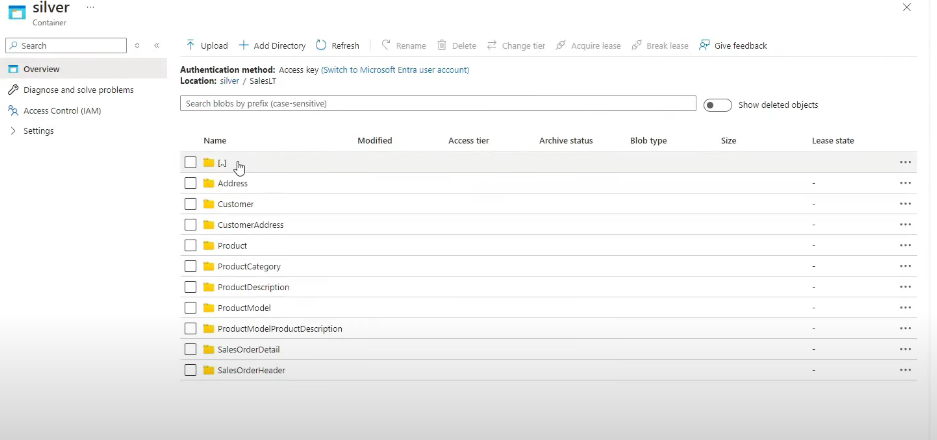
- Transform Data: Use Databricks notebooks to clean and aggregate the data, moving it from bronze to silver and then to gold.
The next step is to go to the Azure Databricks and create a cluster. First we need to mount the ADLS storage. So create a new notebook storgemount. After this create another notebook with name bronze to silver for changing the date format. Once you run this notebook, all the raw data from bronze will get transform and put into silver layer container.
Now after this create another notebook with name silver-to-gold. And use it to transform table’s column names. Now that we have coded all the layers, we want to run all the notebooks automatically. So we will add another two activities (Databricks Notebook) to ADF pipeline such as bronze-to-silver and silver-to-gold.

Step 4: Data Loading and Reporting
- Load Data into Synapse: Set up a Synapse SQL pool and load the gold data for analysis.
- Create Power BI Dashboard: Connect Power BI to Synapse and create visualizations based on business requirements.
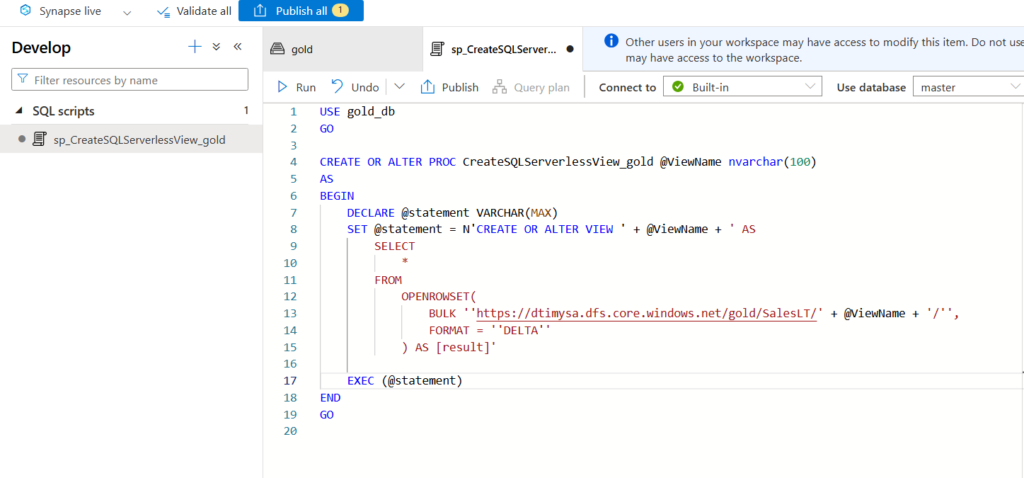
Inside Azure Synapse, we go into the Azure Synapse Analytic Schedule. It’s build on top on ADF with just extra features. Now go the the Data menu and create SQL Database with name gold_db. We can access all the storage containers here. So we can run queries on top of each tables and create different views.

Now we will create views for all the tables using a dynamic query just like below.
Now go to Integrate option in Synapse and create a new pipeline to get table names and create the views for each tables.

Next we can create Power BI Dashboards using this Azure Synapse Warehouse data.

Step 5: Automation and Monitoring
- Schedule Pipelines: Use ADF to schedule the data pipelines to run daily.
- Monitor Pipeline Runs: Use the monitoring tools in ADF and Synapse to ensure successful pipeline execution.
Step 6: Security and Governance
- Manage Access: Set up role-based access control (RBAC) using Azure Entra ID (formerly Active Directory).
Step 7: End-to-End Testing
- Trigger and Test Pipelines: Insert new records into the SQL database and verify that the entire pipeline runs successfully, updating the Power BI dashboard.
Conclusion
This project provides a robust end-to-end solution for understanding customer demographics and their impact on sales. The automated data pipeline ensures that stakeholders always have access to the most current and actionable insights. All the project codes are given here.