Here is a complete explanation of the project: “End to End Data Engineering using Databricks and Lakeflow Spark Declarative Pipeline.” All codes are given here.
Introduction
Modern companies generate huge volumes of data from applications, websites, transactions, IoT devices, and logs. Data engineers are responsible for building data pipelines that ingest, process, transform, and deliver this data for analytics or machine learning.
This project demonstrates how to build a complete data engineering pipeline using Databricks Free Edition and Lakeflow Spark Declarative Pipelines. The project simulates a real-world transportation domain scenario where trip data is processed and converted into analytics-ready datasets.
The pipeline architecture includes:
- Data ingestion
- Data cleaning and transformation
- Data modeling
- Data aggregation
- Analytics-ready outputs
The implementation uses Apache Spark, Databricks Lakehouse architecture, and Lakeflow Declarative Pipelines.
What is Lakeflow Spark Declarative Pipeline?
Traditional Spark pipelines are imperative, meaning you explicitly define every step:
read data
transform data
write data
run next step
But with Declarative Pipelines, you describe: What data should look like, not how to process it.
The system automatically manages:
- dependency management
- execution order
- incremental processing
- pipeline orchestration
Lakeflow Declarative Pipelines is a framework that allows engineers to create batch and streaming pipelines using SQL or Python, while Spark handles execution automatically.
Project Architecture Overview
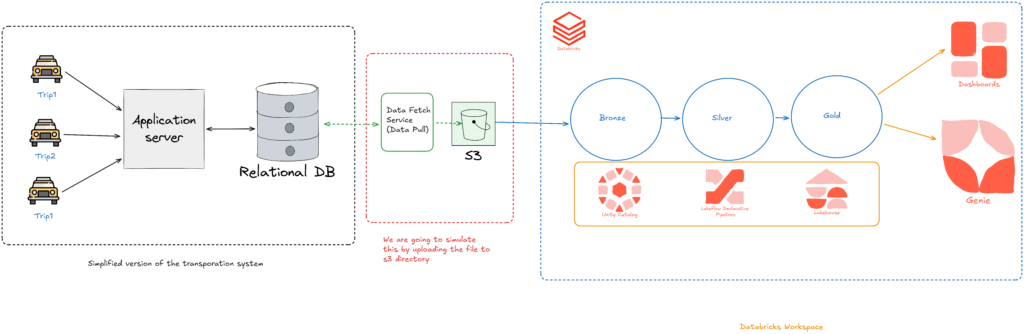
The project uses a Lakehouse architecture with Medallion Layers.
The architecture contains three layers:
Bronze Layer
Raw data ingestion.
Silver Layer
Cleaned and transformed data.
Gold Layer
Business-ready aggregated data.
Business Problem
The project simulates a ride-sharing transportation company.
Data available:
1️⃣ City Dimension Table
Contains:
- city_id
- city_name
2️⃣ Trip Fact Table
Contains trip details such as:
- trip_id
- driver_id
- customer_id
- distance
- fare amount
- ratings
- timestamps
Goal of the pipeline:
Produce city-level analytics such as
- total rides
- total revenue
- average customer rating
- ride distribution by time
This dataset will later be used for BI dashboards.
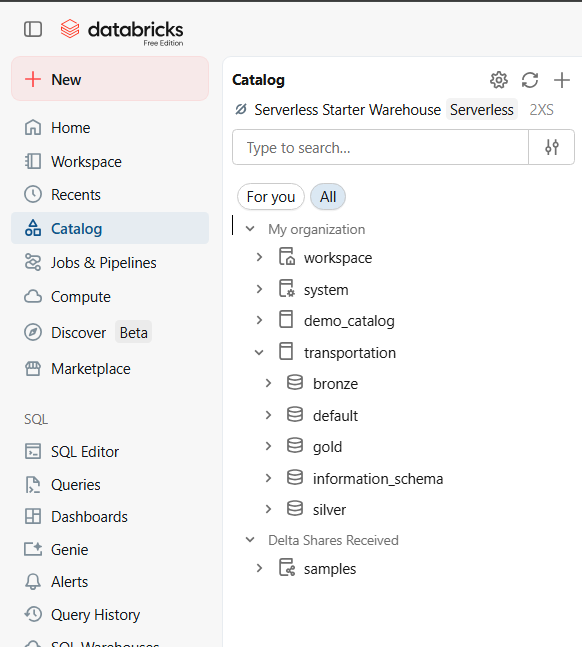
Databricks Environment Setup
The project begins by creating a workspace in Databricks Free Edition.
Key steps:
- Create workspace
- Setup catalog and schemas
- Upload project datasets
- Create pipeline folders
project
│
├── bronze
├── silver
├── gold
The pipeline code is written in Python or SQL using declarative syntax.
Data Ingestion (Bronze Layer)
The first stage of the pipeline loads raw data into the Bronze layer.
Source:
- CSV files stored in Amazon S3 / Cloud Storage
Technology used:
Databricks Auto Loader
Auto Loader automatically:
- detects new files
- processes them incrementally
- prevents duplicate ingestion
Bronze layer features:
- raw data ingestion
- minimal transformation
- metadata columns added
Silver Layer (Data Transformation)
The Silver layer cleans and standardizes the data.
Common transformations include:
Data Cleaning
Examples:
- remove null values
- correct data types
- standardize columns
Data Validation
Example rules:
- ratings must be between 1 and 10
- distance cannot be negative
Data Enrichment
Add metadata:
- processing timestamps
- derived columns
The Silver layer ensures the dataset is clean, validated, and structured.
Change Data Capture (CDC)
One important concept explained is Auto CDC (Change Data Capture).
Instead of reprocessing the entire dataset every time:
CDC only processes:
- new records
- updated records
- deleted records
Benefits:
- faster processing
- reduced compute cost
- scalable pipelines
This is extremely important for large production datasets.
Calendar Dimension Table
The pipeline also generates a calendar dimension table programmatically.
This table contains:
- date
- day
- month
- quarter
- weekday/weekend
- holidays
Gold Layer (Analytics Tables)
The Gold layer combines:
- trip data
- city data
- calendar data
The result is a fully enriched analytics dataset.
Columns include:
- trip_id
- city_name
- date
- fare_amount
- ride_count
- ratings
This table is optimized for:
- reporting
- dashboards
- business insights
Pipeline Execution and Automation
Lakeflow Declarative Pipelines automatically manages:
Pipeline DAG
Dependencies between tables.
The system automatically decides:
- execution order
- scheduling
- retries
Continuous Mode
Pipelines can run in:
- batch mode
- streaming mode
Continuous pipelines automatically process new incoming data.

Security and Governance
The project also demonstrates Unity Catalog integration.
Unity Catalog enables:
- access control
- data governance
- data lineage
- security policies
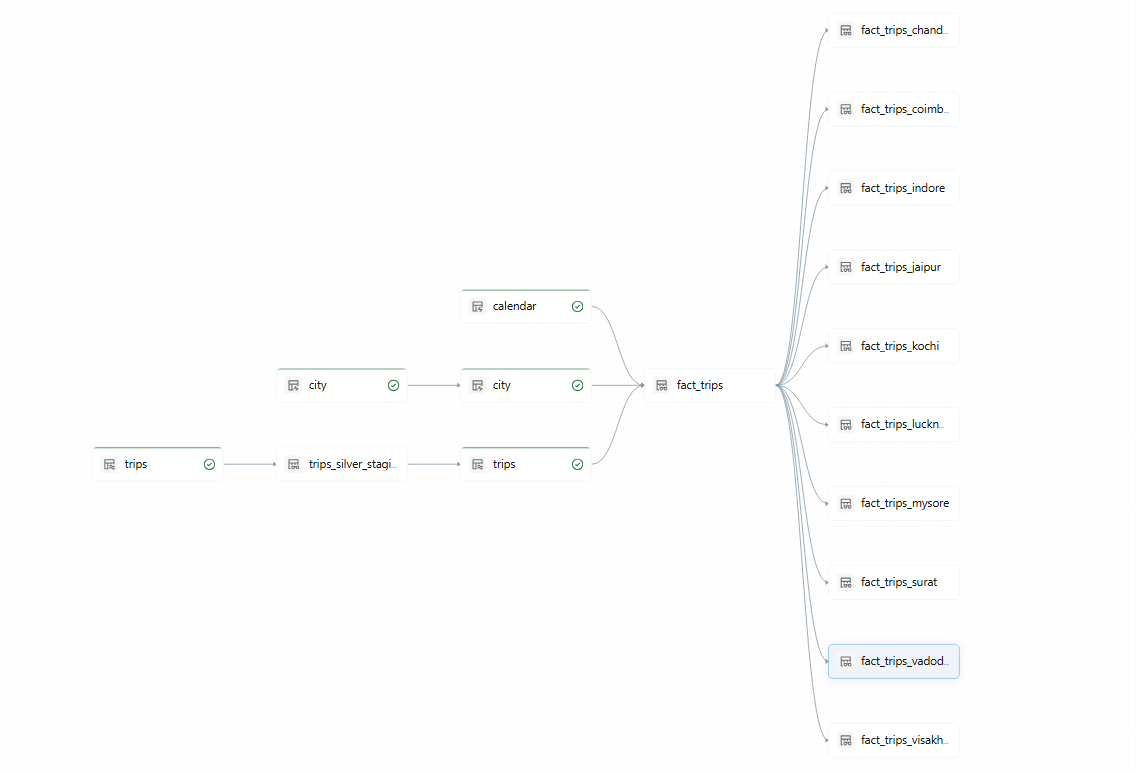
Complete flow of the project:
CSV Data (S3)
↓
Auto Loader
↓
Bronze Tables (Raw)
↓
Silver Tables (Cleaned + Validated)
↓
Calendar Dimension
↓
Gold Tables (Analytics Ready)
↓
City Views
↓
BI Dashboards
Conclusion
This project demonstrates how to build a modern data pipeline using Databricks Lakehouse architecture and Lakeflow Declarative Pipelines. All codes are given here.